Fig. 17
Download original image
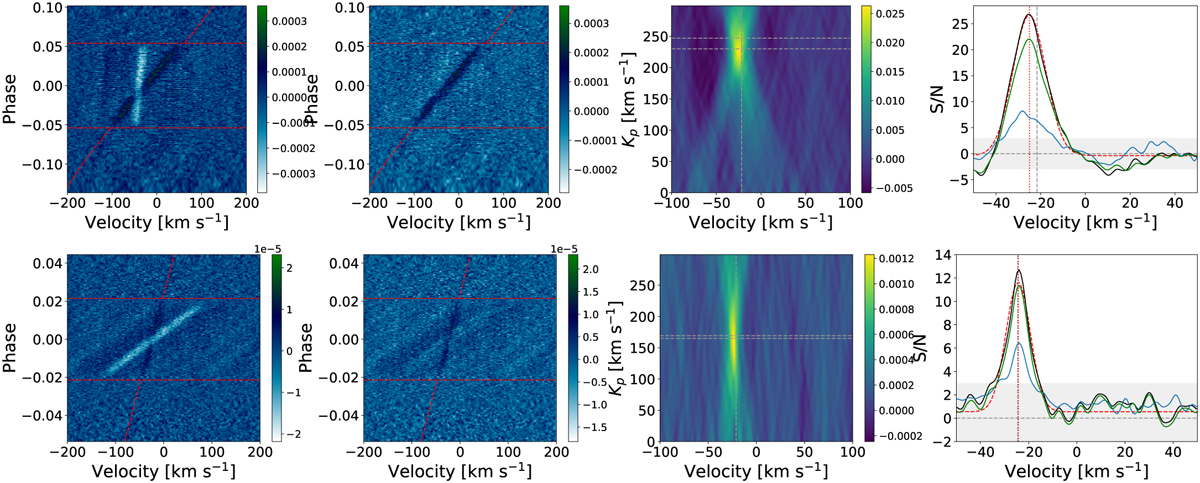
Cross-correlation results for KELT-9b (top panels) and KELT-20b (bottom panels) using all Fe II lines. Left column: cross-correlation residual maps, where the lbright tilted signal is the RM effect, the dark signal is the Fe II atmospheric signal, the red horizontal dashed lines indicate the T1 and T4, and the dashed tilted line represents the expected velocity of the planet where for visualization reasons we assumed vsys equal to the average vsys from the single line analysis. Center-left column: same as the maps in the first column, but after correcting for the RM effect. Center-right column: Kp maps in the range of Kp from 0 to 300 km s−1, where the two horizontal gray dashed lines indicate the theoretical Kp and the best Kp values, respectively, and the vertical gray dashed line indicates the mean vsys value from the single line analysis. Right column: S/N for the best Kp value (black line), fitted Gaussian function (red dashed line), S/N obtained using only the lines detected in the single-line analysis (green line), and S/N obtained using only the lines not detected in the single-line analysis (blue line). The black dashed vertical line indicates the mean vsys value and the red vertical line indicates the velocity of the signal from the Gaussian fit.
Current usage metrics show cumulative count of Article Views (full-text article views including HTML views, PDF and ePub downloads, according to the available data) and Abstracts Views on Vision4Press platform.
Data correspond to usage on the plateform after 2015. The current usage metrics is available 48-96 hours after online publication and is updated daily on week days.
Initial download of the metrics may take a while.