Open Access
Fig. 15
Download original image
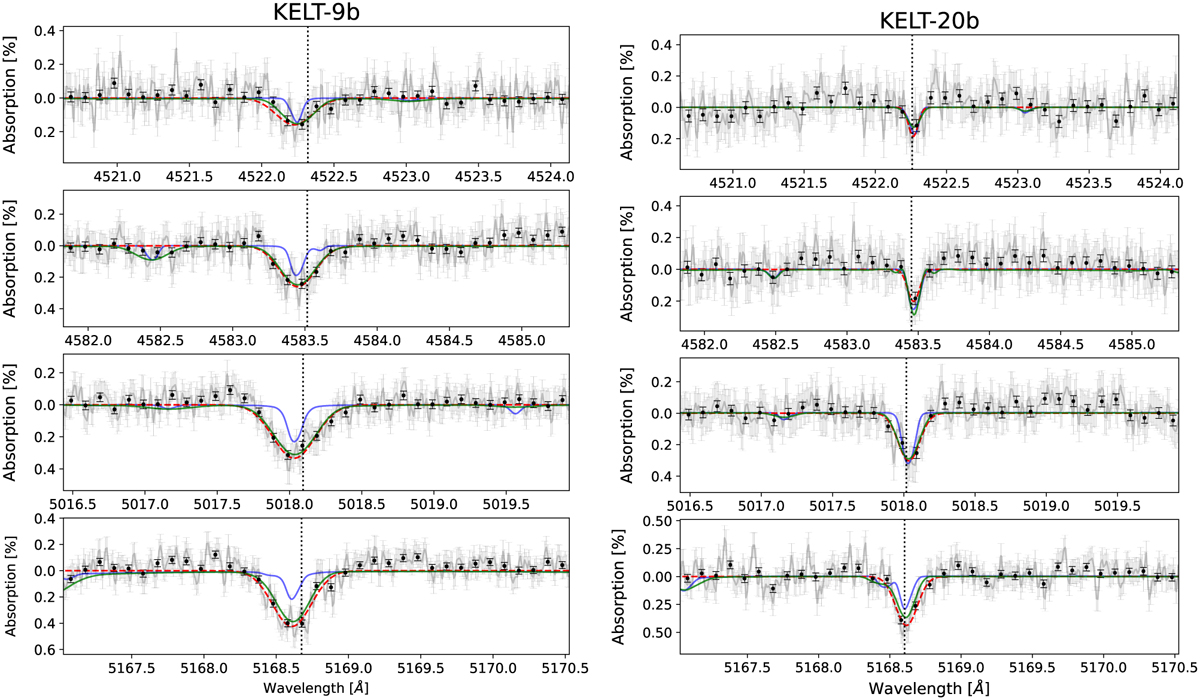
Transmission spectra of the Fe II lines at λ4522 Å, λ4583 Å, λ5018 Å, and λ5169 Å for KELT-9b (left column) and KELT-20b (right column) in comparison to the LTE (blue) and NLTE (green) synthetic profiles computed for the best fitting νmic and νmac values. The red line is the best Gaussian fit of the planetary signal.
Current usage metrics show cumulative count of Article Views (full-text article views including HTML views, PDF and ePub downloads, according to the available data) and Abstracts Views on Vision4Press platform.
Data correspond to usage on the plateform after 2015. The current usage metrics is available 48-96 hours after online publication and is updated daily on week days.
Initial download of the metrics may take a while.