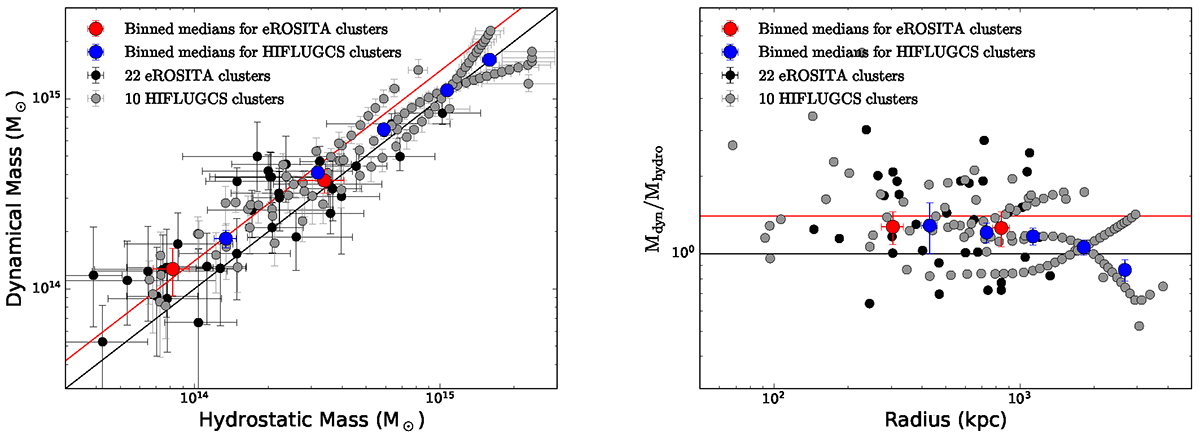
Fig. 7.
Download original image
Comparison between dynamical mass measured from galaxy kinematics with Gravsphere (Read & Steger 2017) and hydrostatic mass from X-ray gas thermodynamics using MBProj2D (Sanders et al. 2018). Black and gray points are the binned data at different radii for the selected 22 eROSITA clusters and 10 HIFLUGCS clusters from Li et al. (2023a), respectively. To demonstrate the trend, the data points are binned as medians according to their mass (left) or radii (right): red points for eROSITA clusters and blue points for HIFLUGCS clusters. Black lines indicate the one-to-one ratio, while red lines show the 40% higher dynamical mass than the hydrostatic mass. Note that the hydrostatic mass for the HIFLUGCS clusters is either from the X-COP database (Eckert et al. 2019; Ettori et al. 2019; Gadotti 2009) when available, or derived from the best-fit β model (Chen et al. 2007).
Current usage metrics show cumulative count of Article Views (full-text article views including HTML views, PDF and ePub downloads, according to the available data) and Abstracts Views on Vision4Press platform.
Data correspond to usage on the plateform after 2015. The current usage metrics is available 48-96 hours after online publication and is updated daily on week days.
Initial download of the metrics may take a while.