Fig. 5.
Download original image
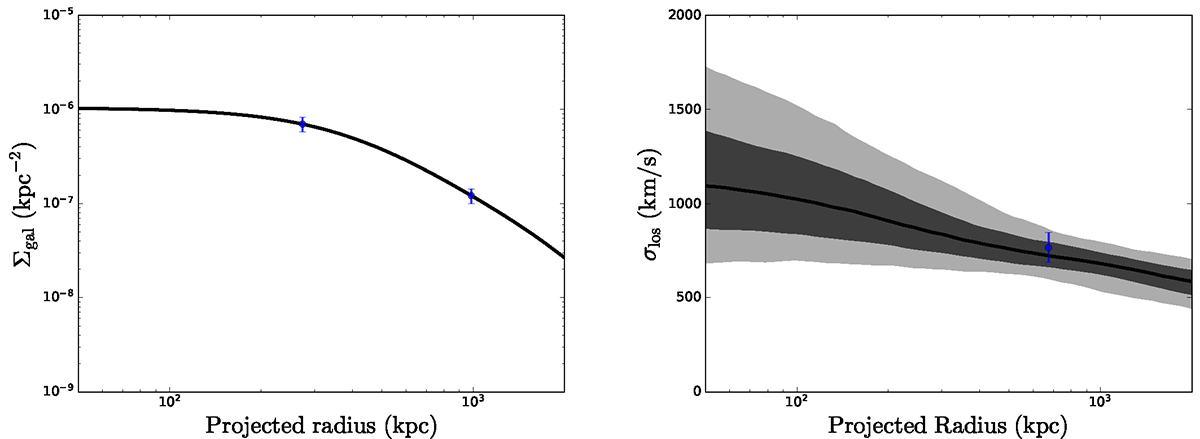
Example fits to the binned cluster galaxies. Left: Galaxy surface number density profile. Points with errors are for the binned photometrically selected galaxies. The solid line is the fit profile with three projected Plummer spheres (Plummer 1911). Right: Line-of-sight velocity dispersion profile. The single point with errors is the binned velocity dispersion using spectroscopically selected galaxies, while the solid line is the expected profile based on the fit mass profile parameterized by the coreNFWtides model (Read et al. 2016). The dark and light shadow regions present 1σ and 2σ limits, respectively. In both profiles, membership probabilities of galaxies are considered when binning. To be consistent with previous figures, the example shown is from 1eRASS J004207.0-283154.
Current usage metrics show cumulative count of Article Views (full-text article views including HTML views, PDF and ePub downloads, according to the available data) and Abstracts Views on Vision4Press platform.
Data correspond to usage on the plateform after 2015. The current usage metrics is available 48-96 hours after online publication and is updated daily on week days.
Initial download of the metrics may take a while.