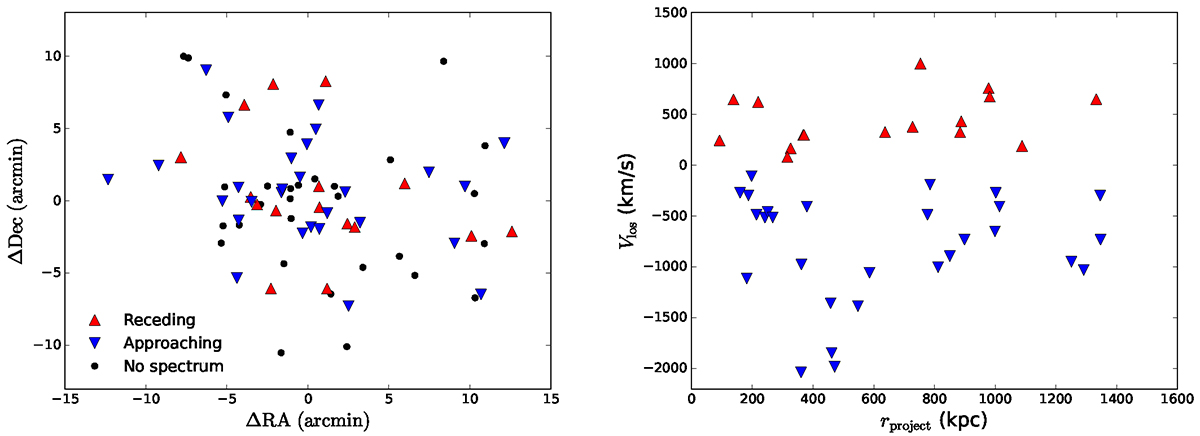
Fig. 4.
Download original image
Example phase-space distributions of cluster galaxies. Left panel: Spatial distribution of the member galaxies of 1eRASS J004207.0-283154 on the projected sky. Red upward triangles and blue downward triangles represent receding and approaching galaxies, respectively. Black points are galaxies without spectroscopic redshift. Right panel: Line-of-sight velocities of the member galaxies with respect to the BCG against the projected radii, rproj. Galaxies with only photometric redshift are excluded in this plot. Cluster 004207.0-283154 presents a slightly asymmetric velocity distribution of its member galaxies. This does not affect the binned velocity dispersion, as galaxies within each bin were fit using the generalized Gaussian function, which allows a variable mean velocity (see Sect. 4.2).
Current usage metrics show cumulative count of Article Views (full-text article views including HTML views, PDF and ePub downloads, according to the available data) and Abstracts Views on Vision4Press platform.
Data correspond to usage on the plateform after 2015. The current usage metrics is available 48-96 hours after online publication and is updated daily on week days.
Initial download of the metrics may take a while.