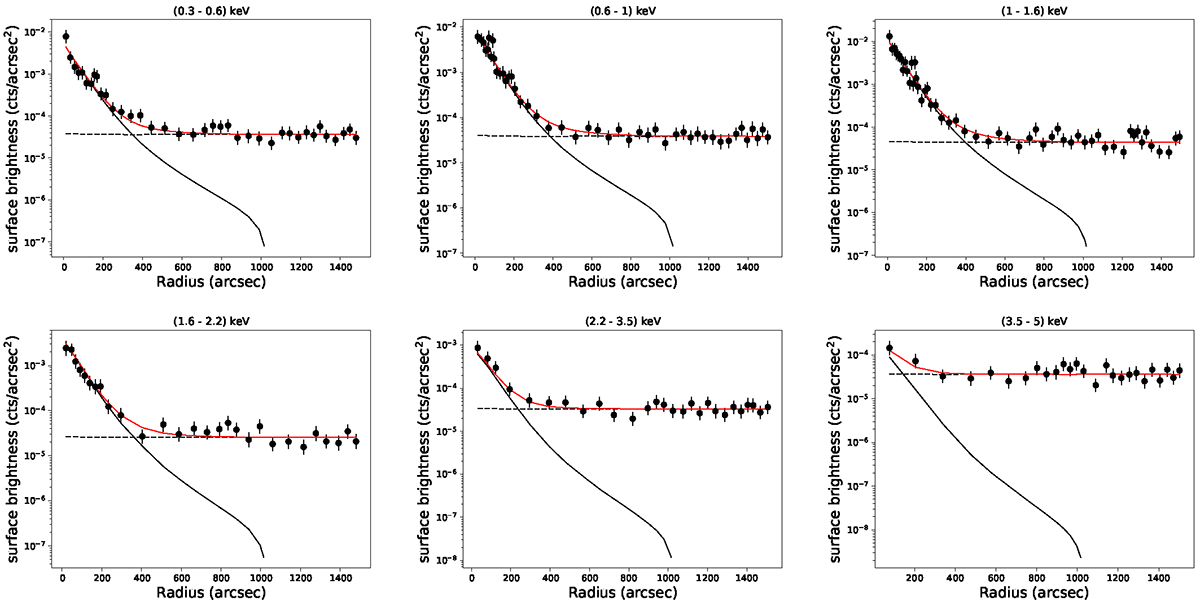
Fig. 2.
Download original image
Surface brightness profiles of 1eRASS J004207.0-283154 in six different energy bands. The azimuthally averaged surface brightness in each band is compared with the total model (red lines), which is the summation of the constant background (dashed black lines) and the cluster model (solid black lines). Cluster models are truncated at 2 Mpc.
Current usage metrics show cumulative count of Article Views (full-text article views including HTML views, PDF and ePub downloads, according to the available data) and Abstracts Views on Vision4Press platform.
Data correspond to usage on the plateform after 2015. The current usage metrics is available 48-96 hours after online publication and is updated daily on week days.
Initial download of the metrics may take a while.