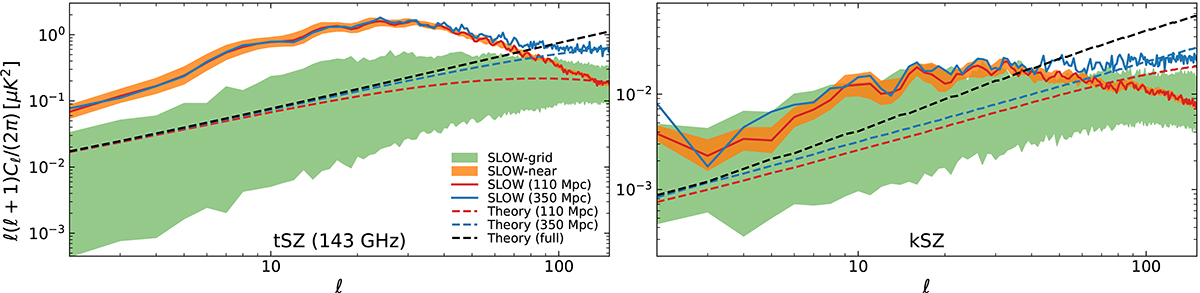
Fig. 8.
Download original image
Local tSZ (left) and kSZ (right) power spectra compared to the average. The solid red and blue lines are power spectra measured from the maps shown in Fig. 1, constructed by integrating electron gas properties through the SLOW simulation from the position of the Milky Way to rmax = 110 and rmax = 350 Mpc, respectively. The colored areas are 90% percentiles determined from the sets of maps where the center for the integration is displaced in the SLOW simulation, slightly (by 1 Mpc from the Milky Way) in orange (SLOW-near), and strongly (more than 100 Mpc between each center) in green (SLOW-grid). The dashed lines show theoretical predictions computed in the halo model, where the red and blue lines are integrated up to rmax = 110 and rmax = 350 Mpc, and the black lines correspond to the full expected tSZ or kSZ signals. The tSZ power spectrum is shown at the frequency 143 GHz.
Current usage metrics show cumulative count of Article Views (full-text article views including HTML views, PDF and ePub downloads, according to the available data) and Abstracts Views on Vision4Press platform.
Data correspond to usage on the plateform after 2015. The current usage metrics is available 48-96 hours after online publication and is updated daily on week days.
Initial download of the metrics may take a while.