Fig. 4.
Download original image
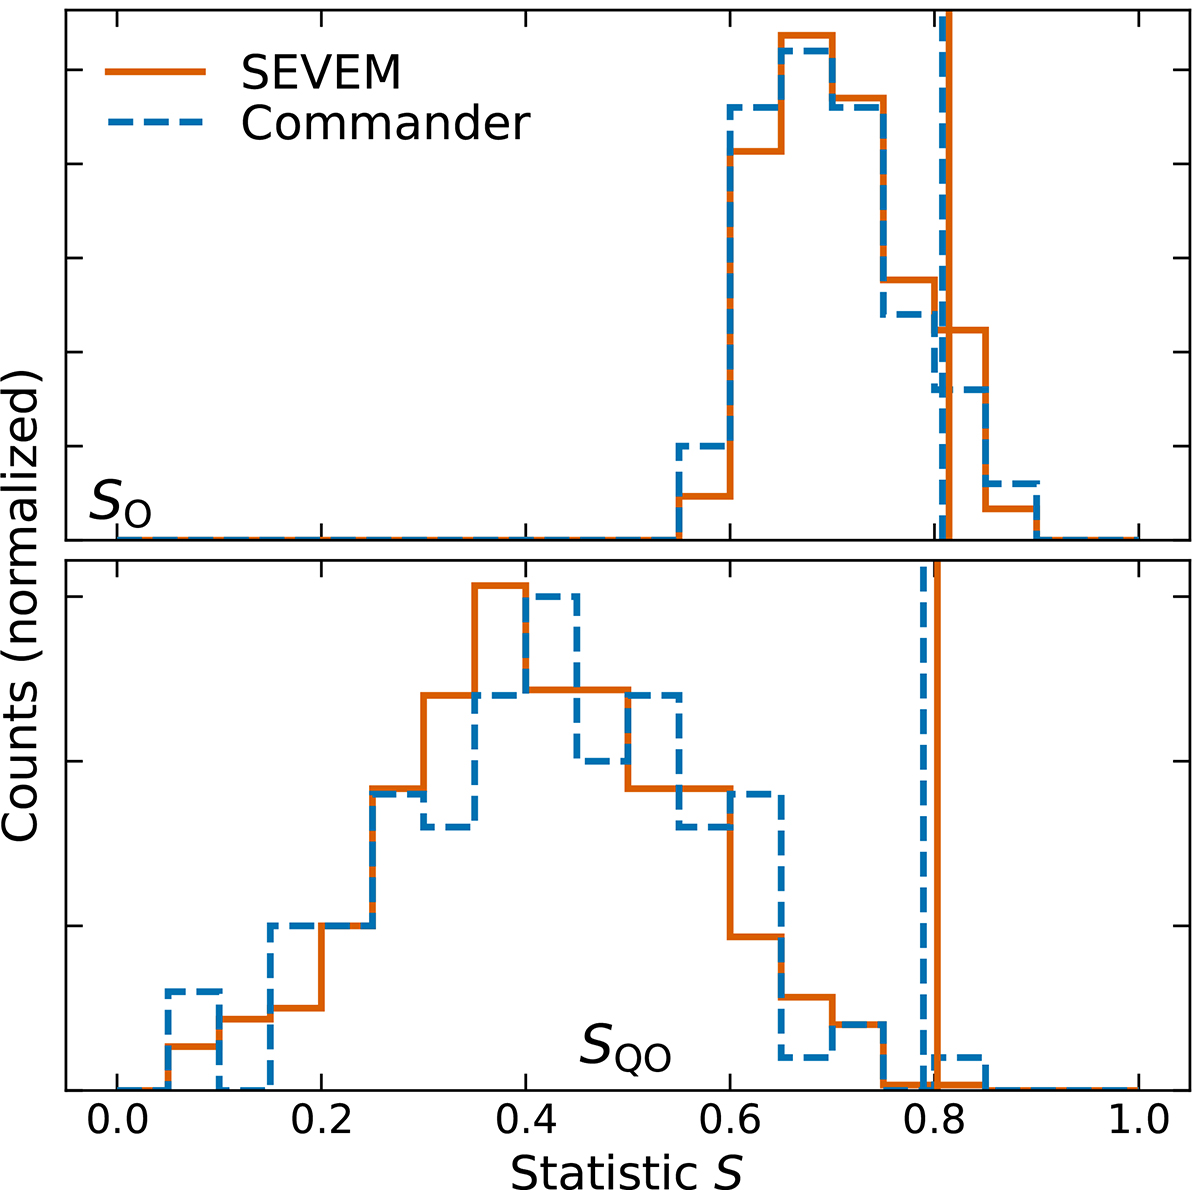
Quadrupole-octopole alignment in the cleaned Planck PR4 CMB temperature maps. In the upper panel, we show the distribution of SO (see Eq. (6)), indicating the planarity of the octopole is. Higher values are obtained for 59 SEVEM simulations (out of 600) and 9 (out of 100) for Commander. In the lower panel, we show the distribution of SQO, measuring the alignment between quadrupole and octopole. Only one simulation in both sets has a higher SQO value than the observed data. The solid orange and dashed blue lines correspond to the SEVEM and Commander maps, respectively.
Current usage metrics show cumulative count of Article Views (full-text article views including HTML views, PDF and ePub downloads, according to the available data) and Abstracts Views on Vision4Press platform.
Data correspond to usage on the plateform after 2015. The current usage metrics is available 48-96 hours after online publication and is updated daily on week days.
Initial download of the metrics may take a while.