Fig. 3.
Download original image
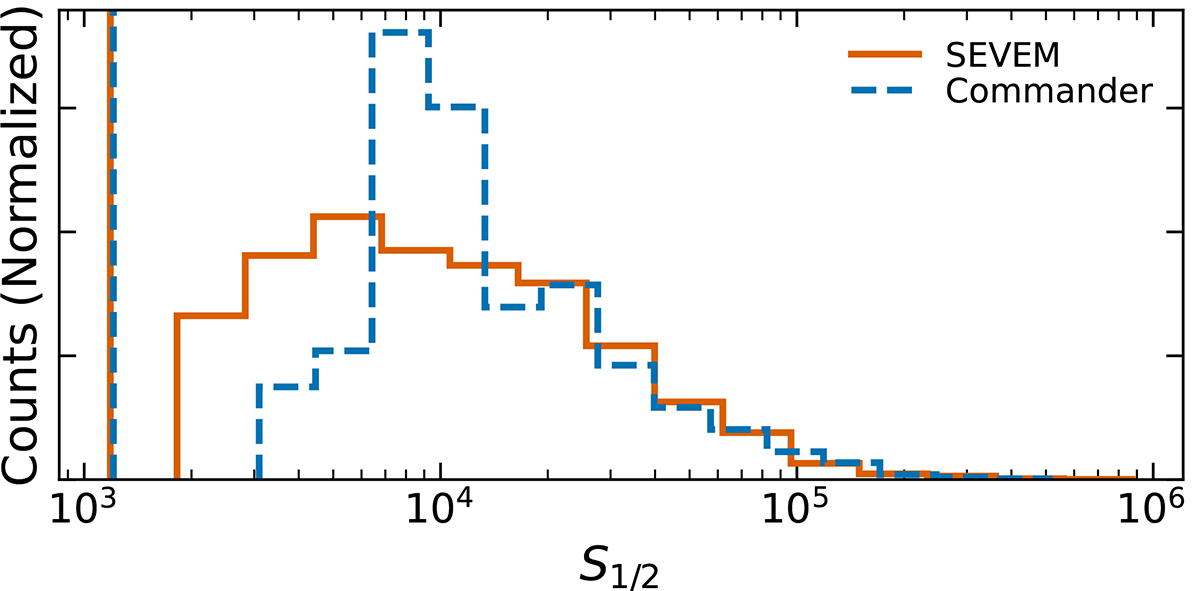
Lack of correlation on large angular scales (θ > 60°) in the cleaned Planck PR4 CMB temperature maps. We show the distribution of the statistic S1/2 (Eq. (4)) measured in the Planck PR4 simulations, and the vertical lines (on the left) are the observed values. The dashed blue and solid orange lines correspond to the Commander and SEVEM maps, respectively. None of the measured S1/2 in the simulations is as low as in the observations.
Current usage metrics show cumulative count of Article Views (full-text article views including HTML views, PDF and ePub downloads, according to the available data) and Abstracts Views on Vision4Press platform.
Data correspond to usage on the plateform after 2015. The current usage metrics is available 48-96 hours after online publication and is updated daily on week days.
Initial download of the metrics may take a while.