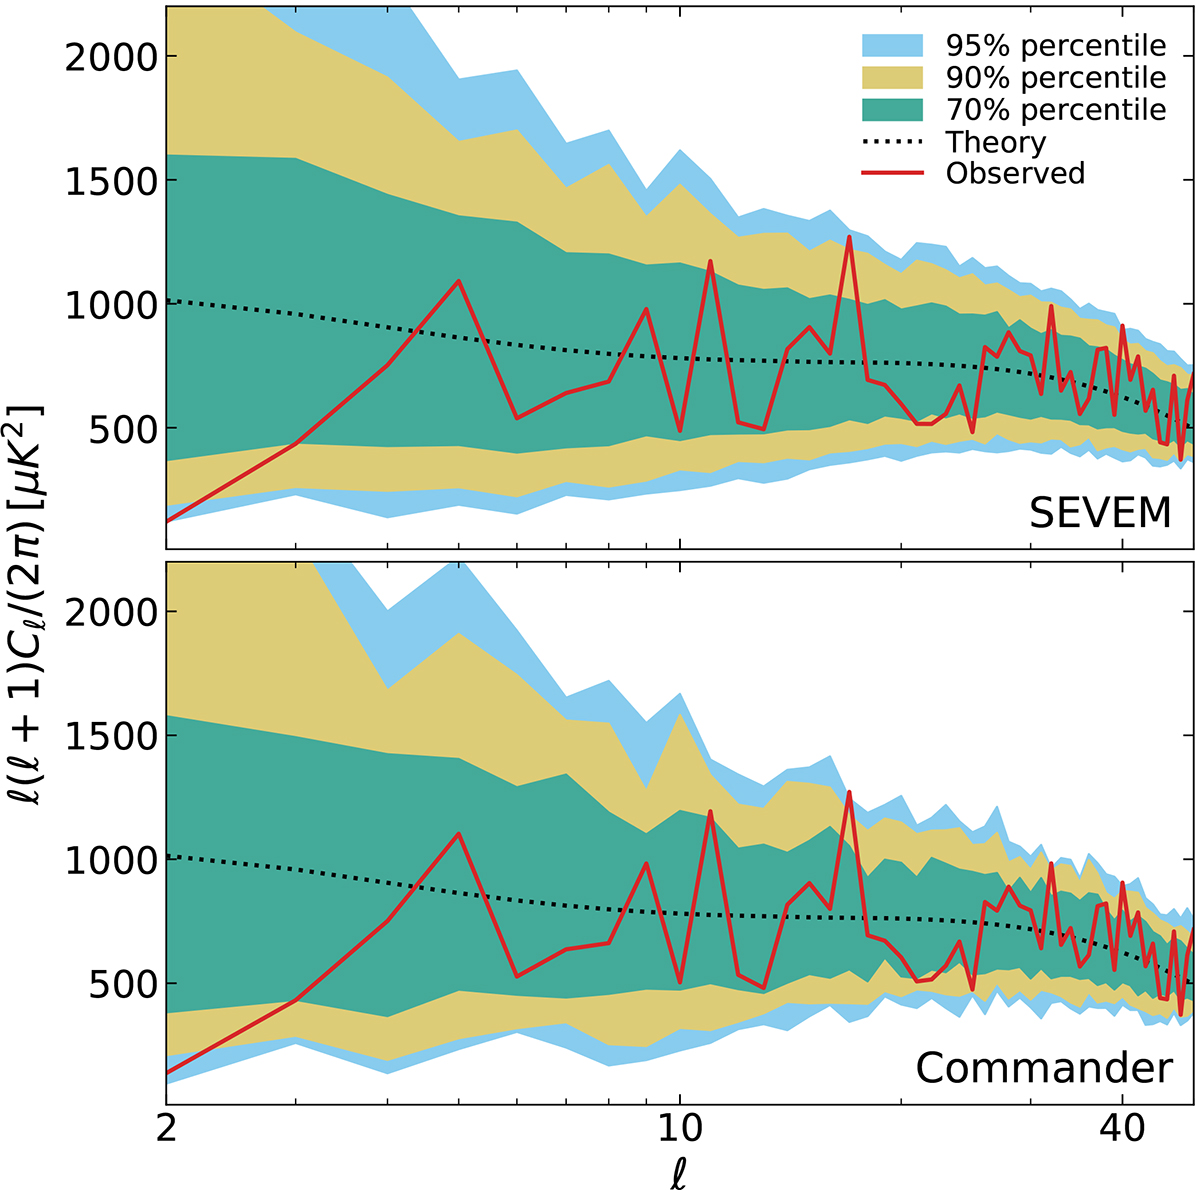
Fig. 2.
Download original image
Pseudo-Cℓ of the Planck PR4 CMB temperature maps from SEVEM (top panel) and Commander (bottom panel). The solid red lines are measured from cleaned observed maps, and the dotted black lines are theoretical predictions computed using CAMB. The colored areas are determined from simulations and show their distribution around the median. For the two component separation methods, the observed quadrupole belongs to the lowest 5% of the simulated values (only 15 SEVEM simulations out of 600 have a lower quadrupole, and 4 for Commander). Only 15% of the simulations have a smaller octopole.
Current usage metrics show cumulative count of Article Views (full-text article views including HTML views, PDF and ePub downloads, according to the available data) and Abstracts Views on Vision4Press platform.
Data correspond to usage on the plateform after 2015. The current usage metrics is available 48-96 hours after online publication and is updated daily on week days.
Initial download of the metrics may take a while.