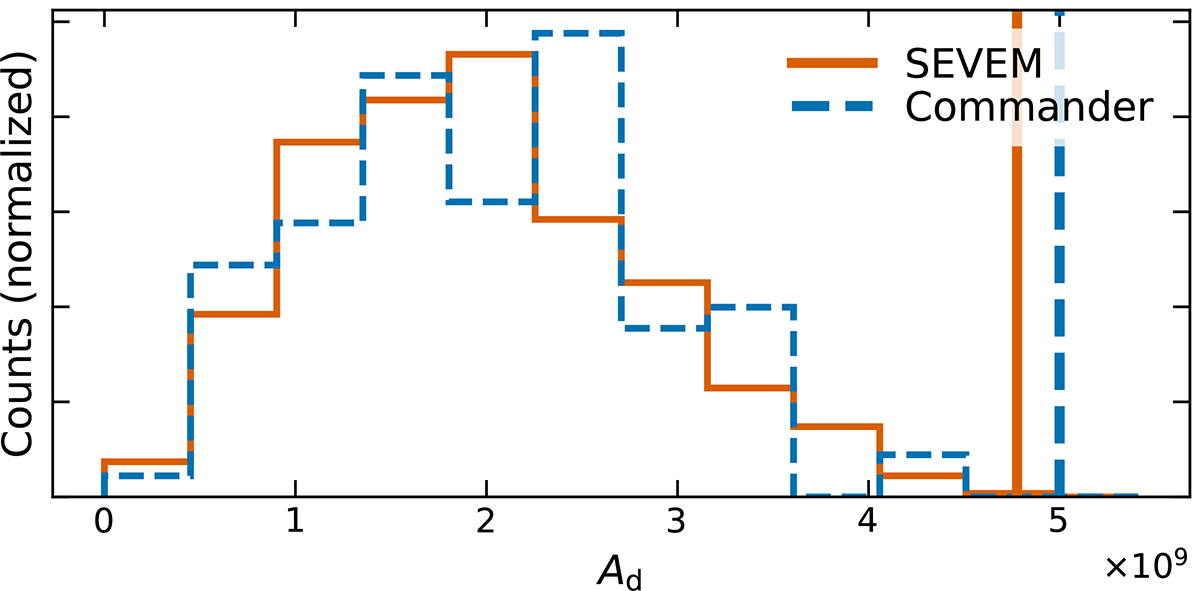
Fig. B.3.
Download original image
Distribution of the amplitude of the position-dependent variance dipole (using disks of 4° radius) in the Planck PR4 CMB temperature data illustrating the hemispherical asymmetry anomaly. The orange and blue vertical lines correspond to the observed SEVEM and Commander maps, respectively, and the histograms are obtained from the corresponding 600 SEVEM (orange), and 100 Commander (blue) simulations. None of the simulated CMB maps have a large dipole amplitude value.
Current usage metrics show cumulative count of Article Views (full-text article views including HTML views, PDF and ePub downloads, according to the available data) and Abstracts Views on Vision4Press platform.
Data correspond to usage on the plateform after 2015. The current usage metrics is available 48-96 hours after online publication and is updated daily on week days.
Initial download of the metrics may take a while.