Fig. B.2.
Download original image
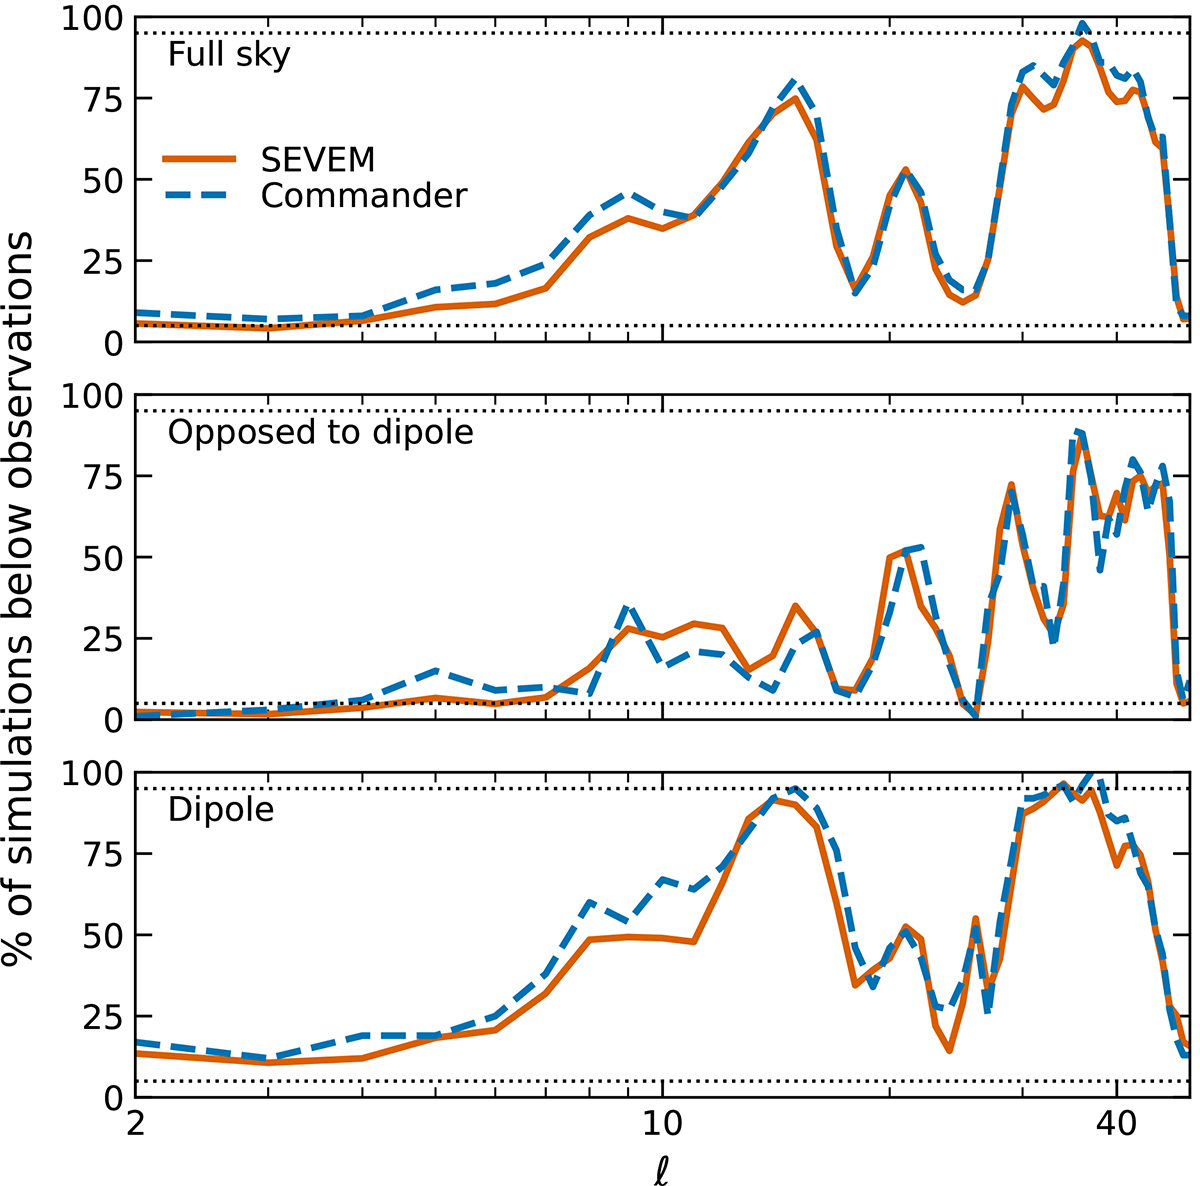
Comparison between the position-dependent power spectrum in the Planck PR4 CMB temperature data and simulated maps. We average the position-dependent power spectrum over the full sky (upper panel), and the two hemispheres defined by the dipole of each multipole (opposed to dipole in the middle panel and dipole direction otherwise), and compare the observed value to the equivalent from the simulations. We show the percentage of simulations having a lower value than the data. Horizontal black dotted lines indicate the 5% and 95% thresholds.
Current usage metrics show cumulative count of Article Views (full-text article views including HTML views, PDF and ePub downloads, according to the available data) and Abstracts Views on Vision4Press platform.
Data correspond to usage on the plateform after 2015. The current usage metrics is available 48-96 hours after online publication and is updated daily on week days.
Initial download of the metrics may take a while.