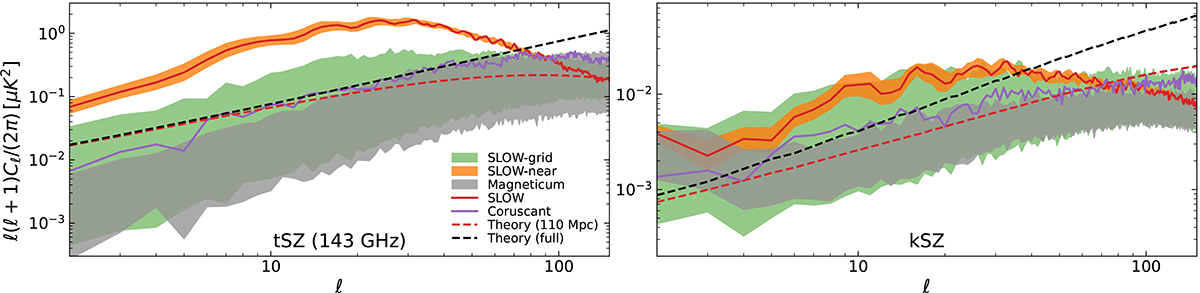
Fig. 11.
Download original image
tSZ and kSZ power spectra up to rmax = 110 Mpc from several hydrodynamical simulations. As in Fig. 8, the solid red line and the orange and green areas are determined from the SLOW simulation, and the dashed lines are the corresponding predictions from the halo model. The solid purple lines are estimated from local Universe maps determined from the Coruscant simulation, and the gray areas are 90% percentiles from the Magneticum simulation.
Current usage metrics show cumulative count of Article Views (full-text article views including HTML views, PDF and ePub downloads, according to the available data) and Abstracts Views on Vision4Press platform.
Data correspond to usage on the plateform after 2015. The current usage metrics is available 48-96 hours after online publication and is updated daily on week days.
Initial download of the metrics may take a while.