Fig. 1.
Download original image
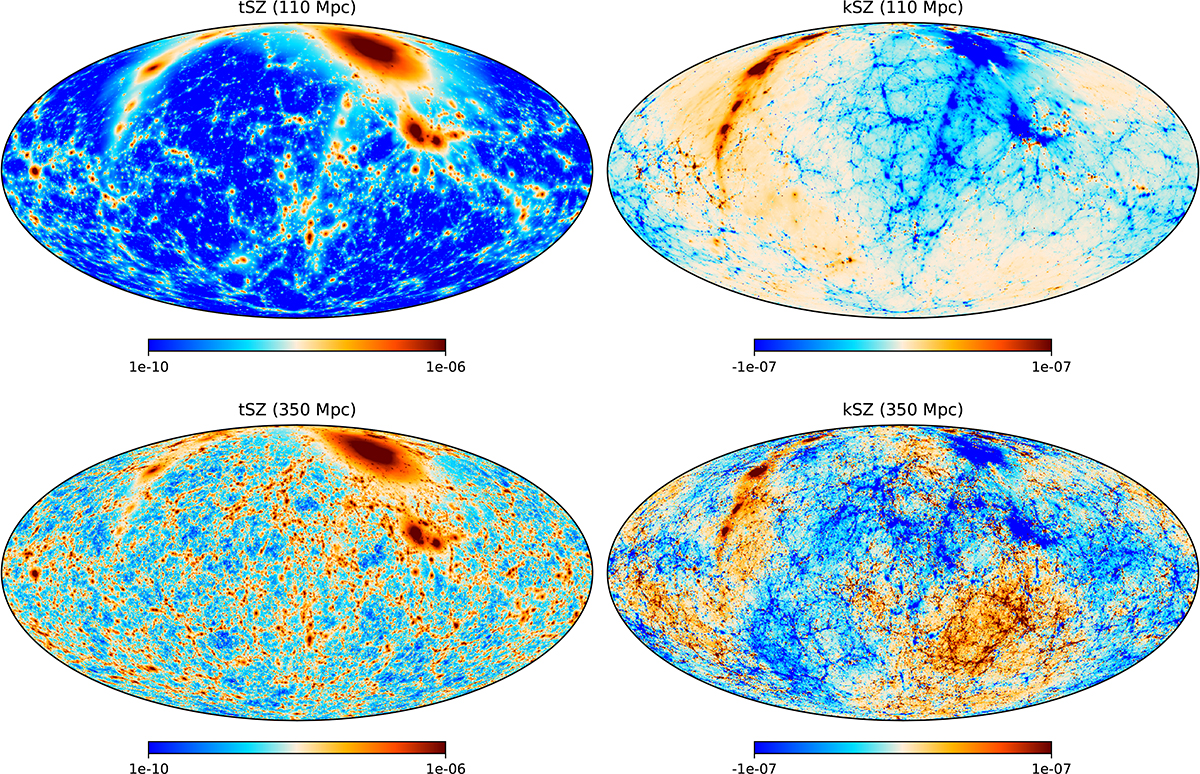
tSZ (y-Compton) and kSZ signals from the local Universe in the SLOW constrained simulation. The upper panels only include the most local structures (up to 110 Mpc, denoted SLOW-110), and the lower panels use almost the full volume of the box (up to 350 Mpc, denoted SLOW-350). The color scale is logarithmic in the tSZ maps and symmetric logarithmic for the kSZ maps. The main characteristics of these maps are recalled in Table 2.
Current usage metrics show cumulative count of Article Views (full-text article views including HTML views, PDF and ePub downloads, according to the available data) and Abstracts Views on Vision4Press platform.
Data correspond to usage on the plateform after 2015. The current usage metrics is available 48-96 hours after online publication and is updated daily on week days.
Initial download of the metrics may take a while.