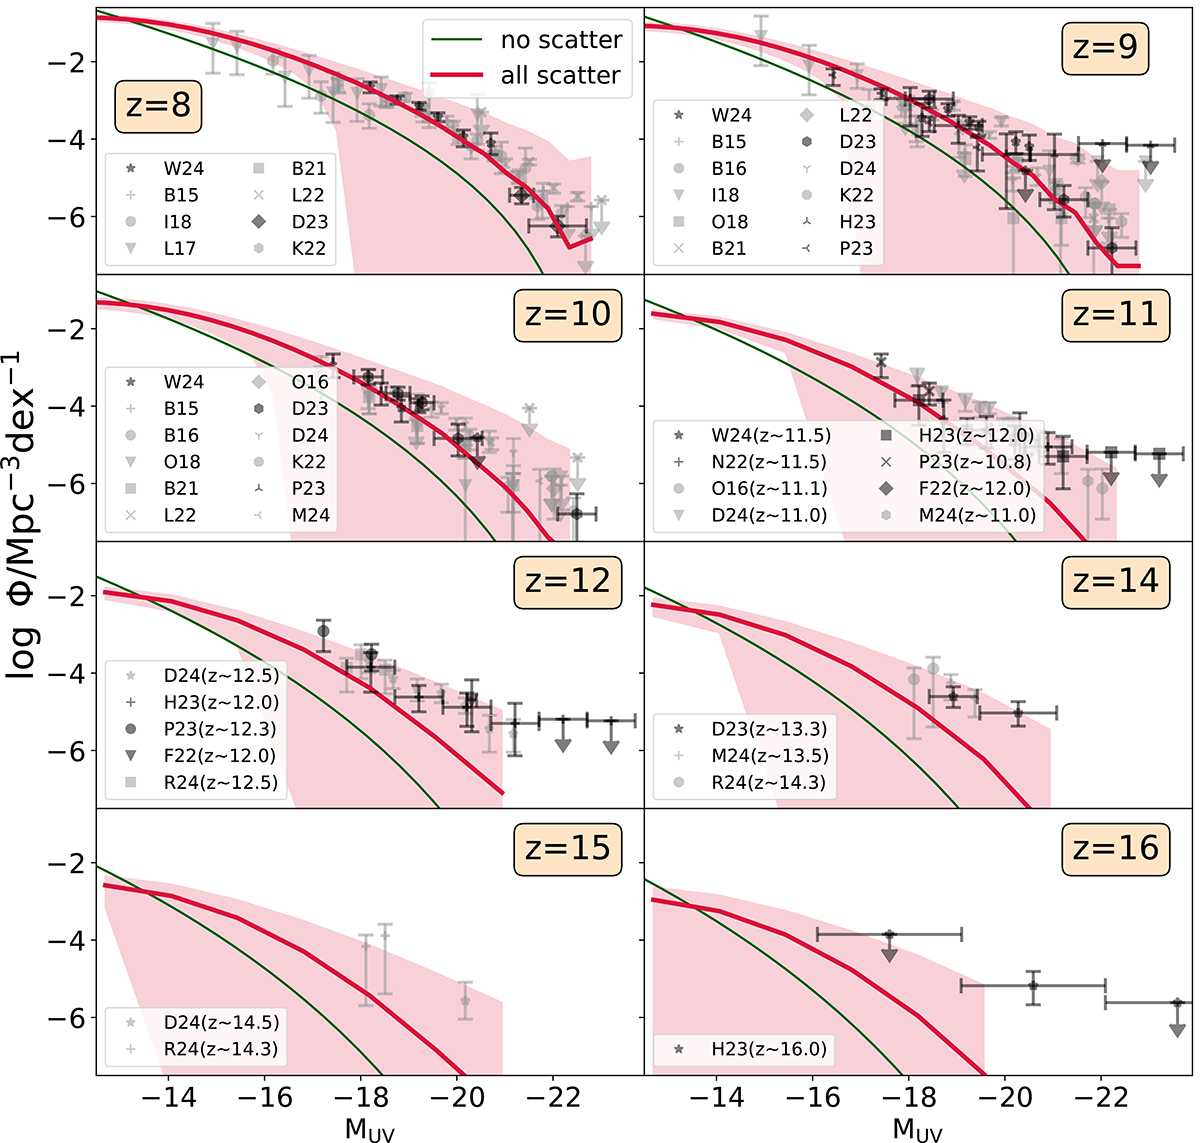
Fig. 12.
Download original image
High redshift UV luminosity functions. Our fiducial model including all of the aforementioned sources of scatter is shown with the red solid lines (mean values) and surrounding shaded regions (68% C.L.s). The solid green curves correspond to UV LFs calculated using only mean relations without any scatter. Also shown in each panel are various observational estimates from HST and JWST (see text for details).
Current usage metrics show cumulative count of Article Views (full-text article views including HTML views, PDF and ePub downloads, according to the available data) and Abstracts Views on Vision4Press platform.
Data correspond to usage on the plateform after 2015. The current usage metrics is available 48-96 hours after online publication and is updated daily on week days.
Initial download of the metrics may take a while.