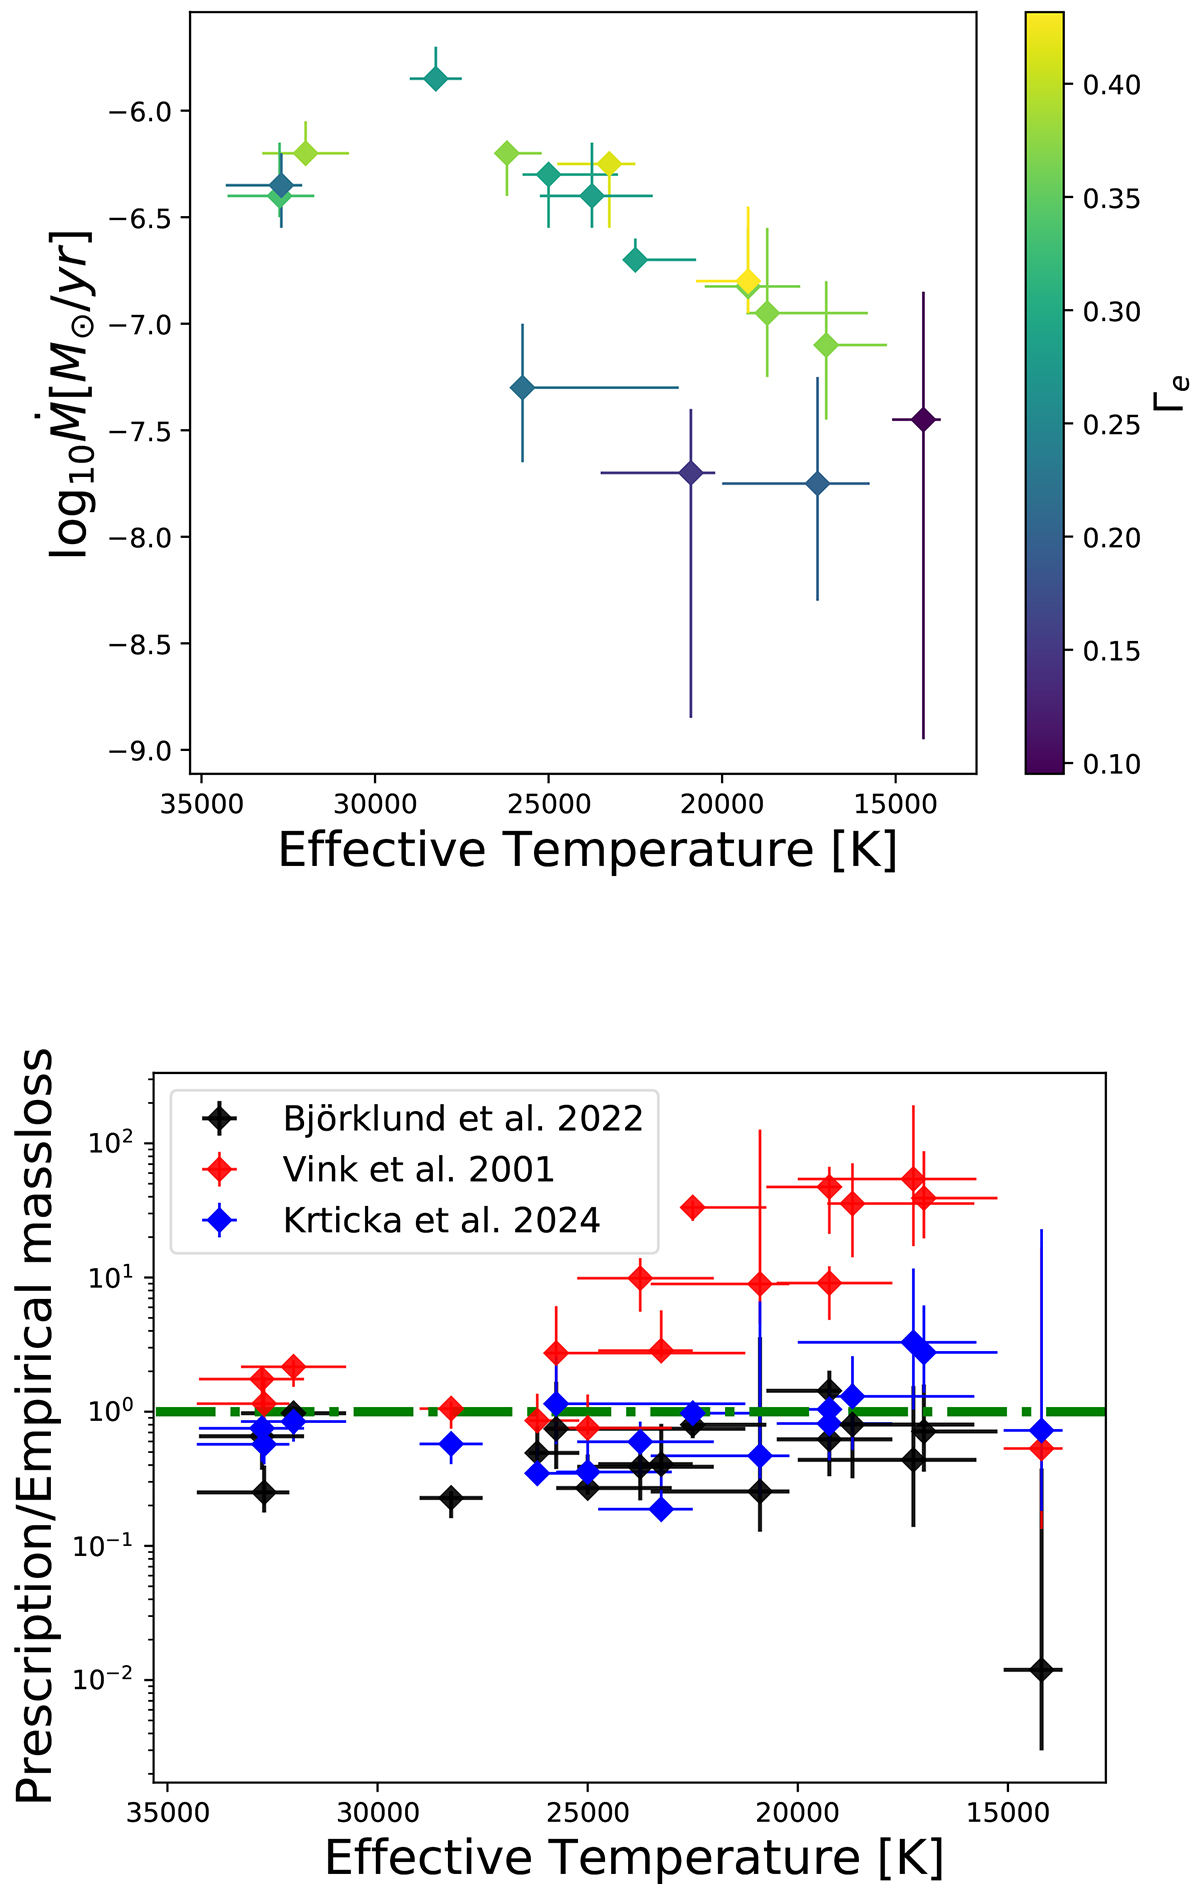
Fig. 12.
Download original image
Derived mass-loss rates for our sample as function of effective temperature. The top plot shows the derived mass-loss rates and he colour shows the derived classical Eddington parameter for each star. The bottom plot shows the ratio between the theoretical prescriptions by Vink et al. (2001), Björklund et al. (2023), Krtika et al. (2024) and the empirically found values. The green line indicates where these are equal.
Current usage metrics show cumulative count of Article Views (full-text article views including HTML views, PDF and ePub downloads, according to the available data) and Abstracts Views on Vision4Press platform.
Data correspond to usage on the plateform after 2015. The current usage metrics is available 48-96 hours after online publication and is updated daily on week days.
Initial download of the metrics may take a while.