Fig. 4
Download original image
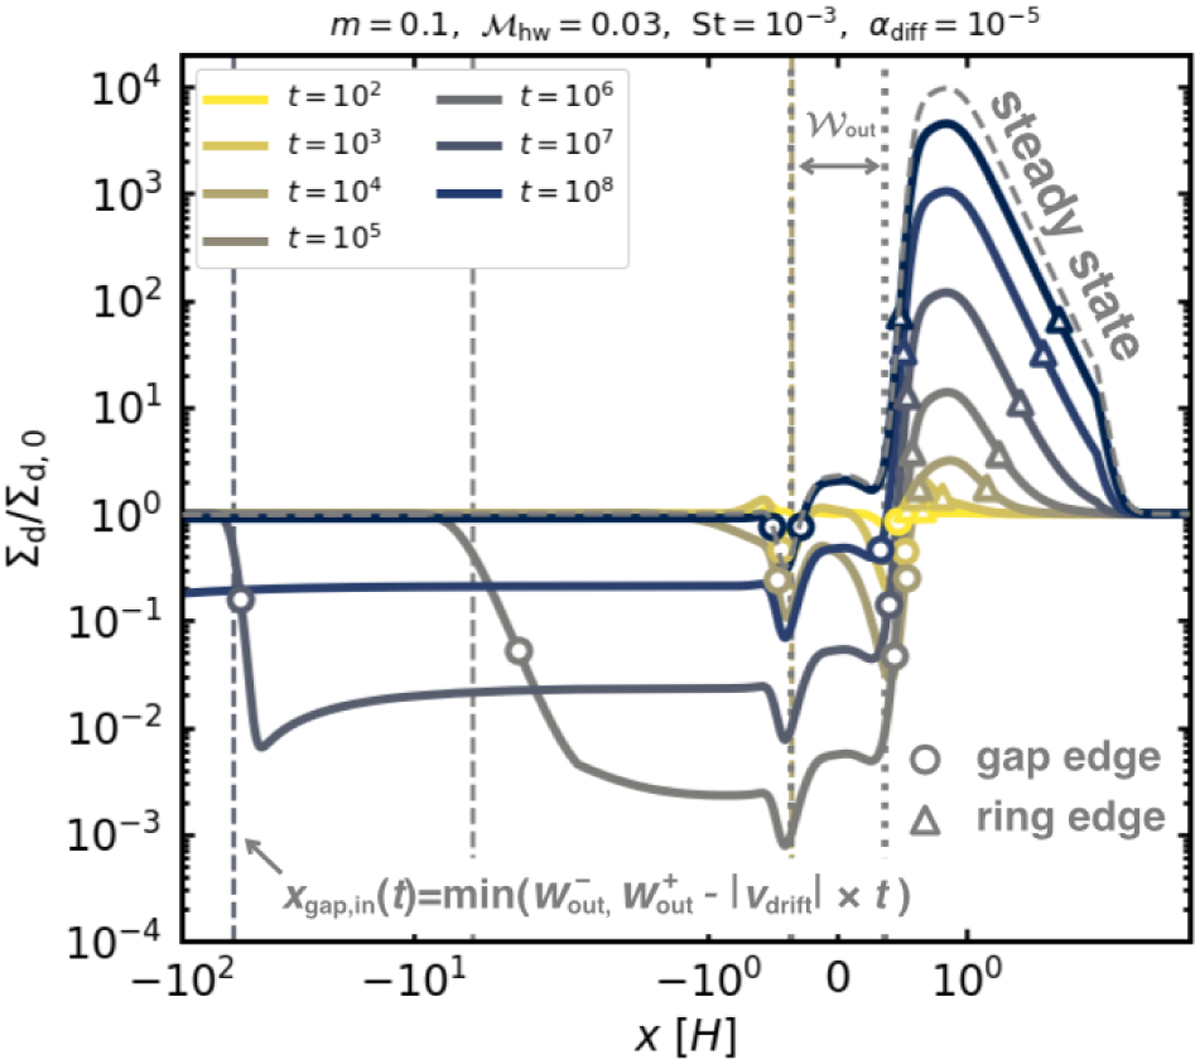
Time evolution of the dust surface density in low-turbulence disks. We set m = 0.1, ℳhw = 0.03, St = 10−3, and αdiff = 10−5. The horizontal axis is on a log scale, whose range is extended to x ∈ [−100, 5]. The vertical dashed lines show the analytic model of the location of the inner edge of the dust gap, which moves with vdrift (Sect. 4.4).
Current usage metrics show cumulative count of Article Views (full-text article views including HTML views, PDF and ePub downloads, according to the available data) and Abstracts Views on Vision4Press platform.
Data correspond to usage on the plateform after 2015. The current usage metrics is available 48-96 hours after online publication and is updated daily on week days.
Initial download of the metrics may take a while.