Fig. 3
Download original image
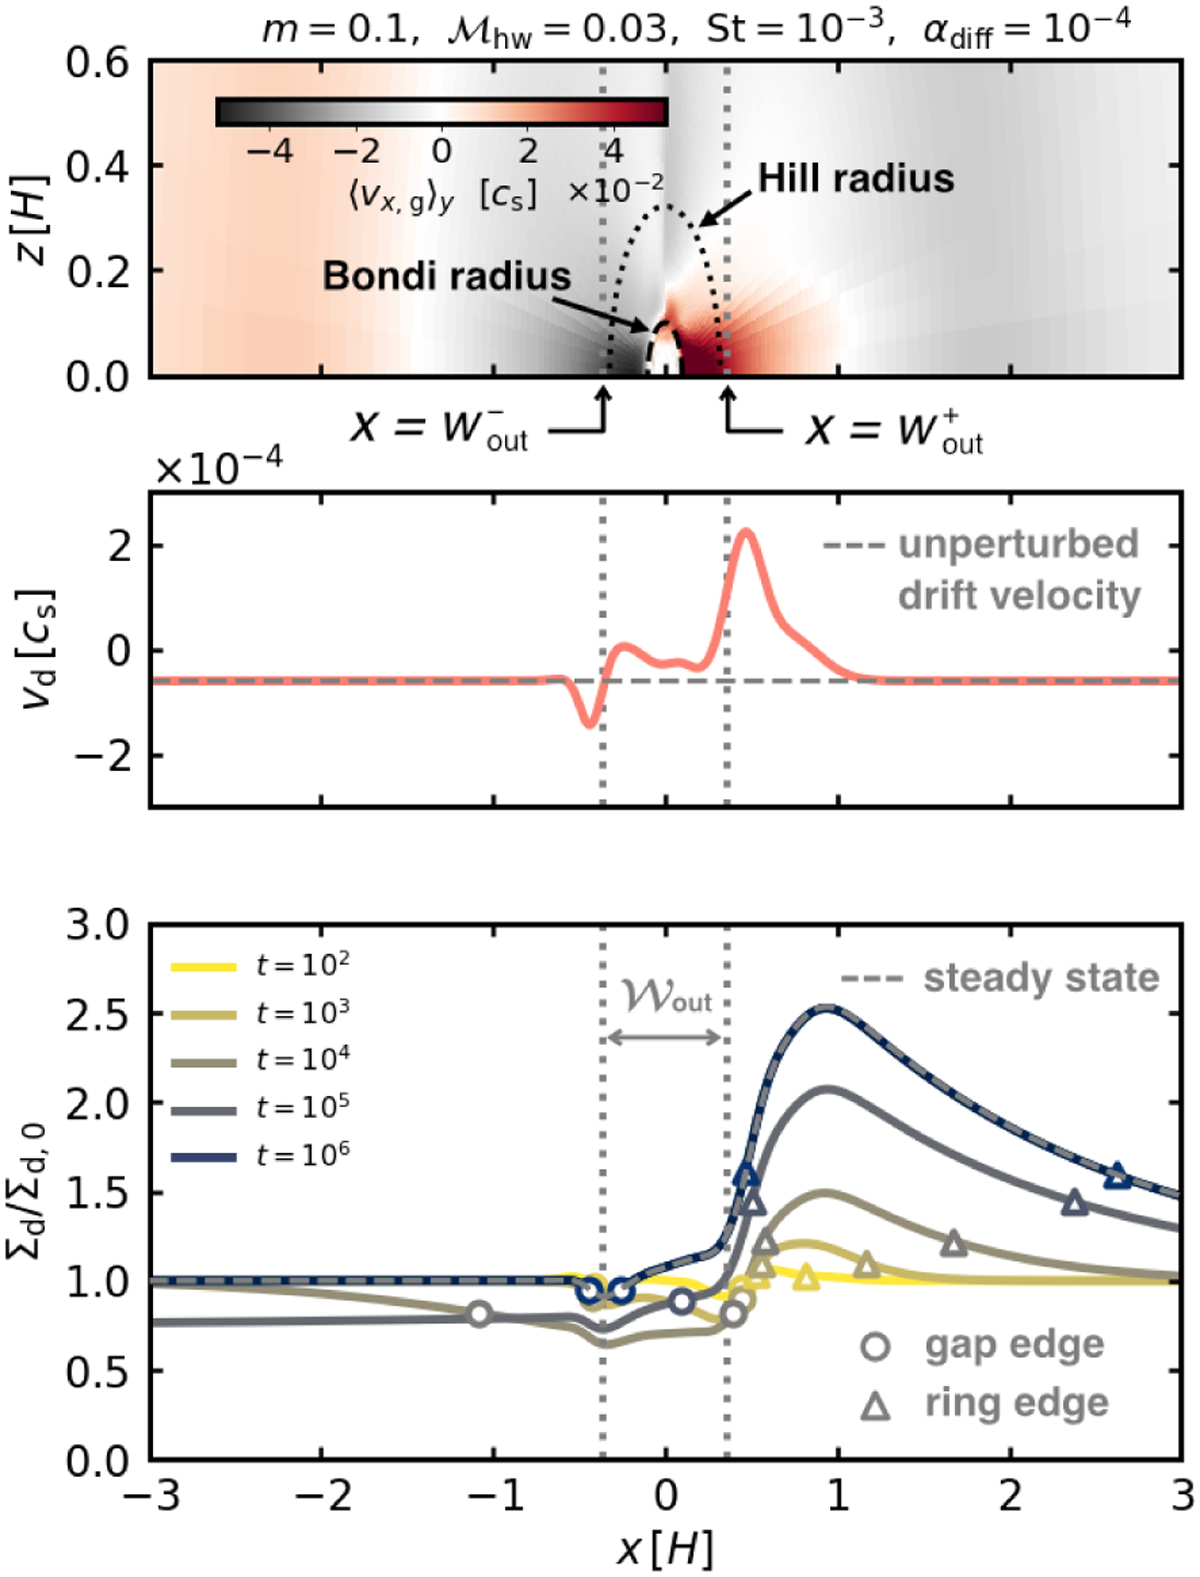
Perturbation of the planet-induced gas flow on the radial velocity of dust and the dust surface density. We set m = 0.1, ℳhw = 0.03, St = 10−3, and αdiff = 10−4. Top: gas flow structure at the meridian plane. The color contour represents the gas velocity in the x-direction averaged in the y-direction within the calculation domain of hydrodynamical simulation, 〈vx,g〉y. The vertical dotted lines represent the x-coordinates of the edges of the outflow region, ![]() . Middle: perturbed radial drift velocity of dust. The horizontal dashed line represents vdrift. Bottom: time evolution of the dust surface density. The gray dashed line corresponds to the steady-state dust surface density. The circle and triangle symbols denote the location of the numerically calculated edges of the dust gap and ring.
. Middle: perturbed radial drift velocity of dust. The horizontal dashed line represents vdrift. Bottom: time evolution of the dust surface density. The gray dashed line corresponds to the steady-state dust surface density. The circle and triangle symbols denote the location of the numerically calculated edges of the dust gap and ring.
Current usage metrics show cumulative count of Article Views (full-text article views including HTML views, PDF and ePub downloads, according to the available data) and Abstracts Views on Vision4Press platform.
Data correspond to usage on the plateform after 2015. The current usage metrics is available 48-96 hours after online publication and is updated daily on week days.
Initial download of the metrics may take a while.