Fig. 19
Download original image
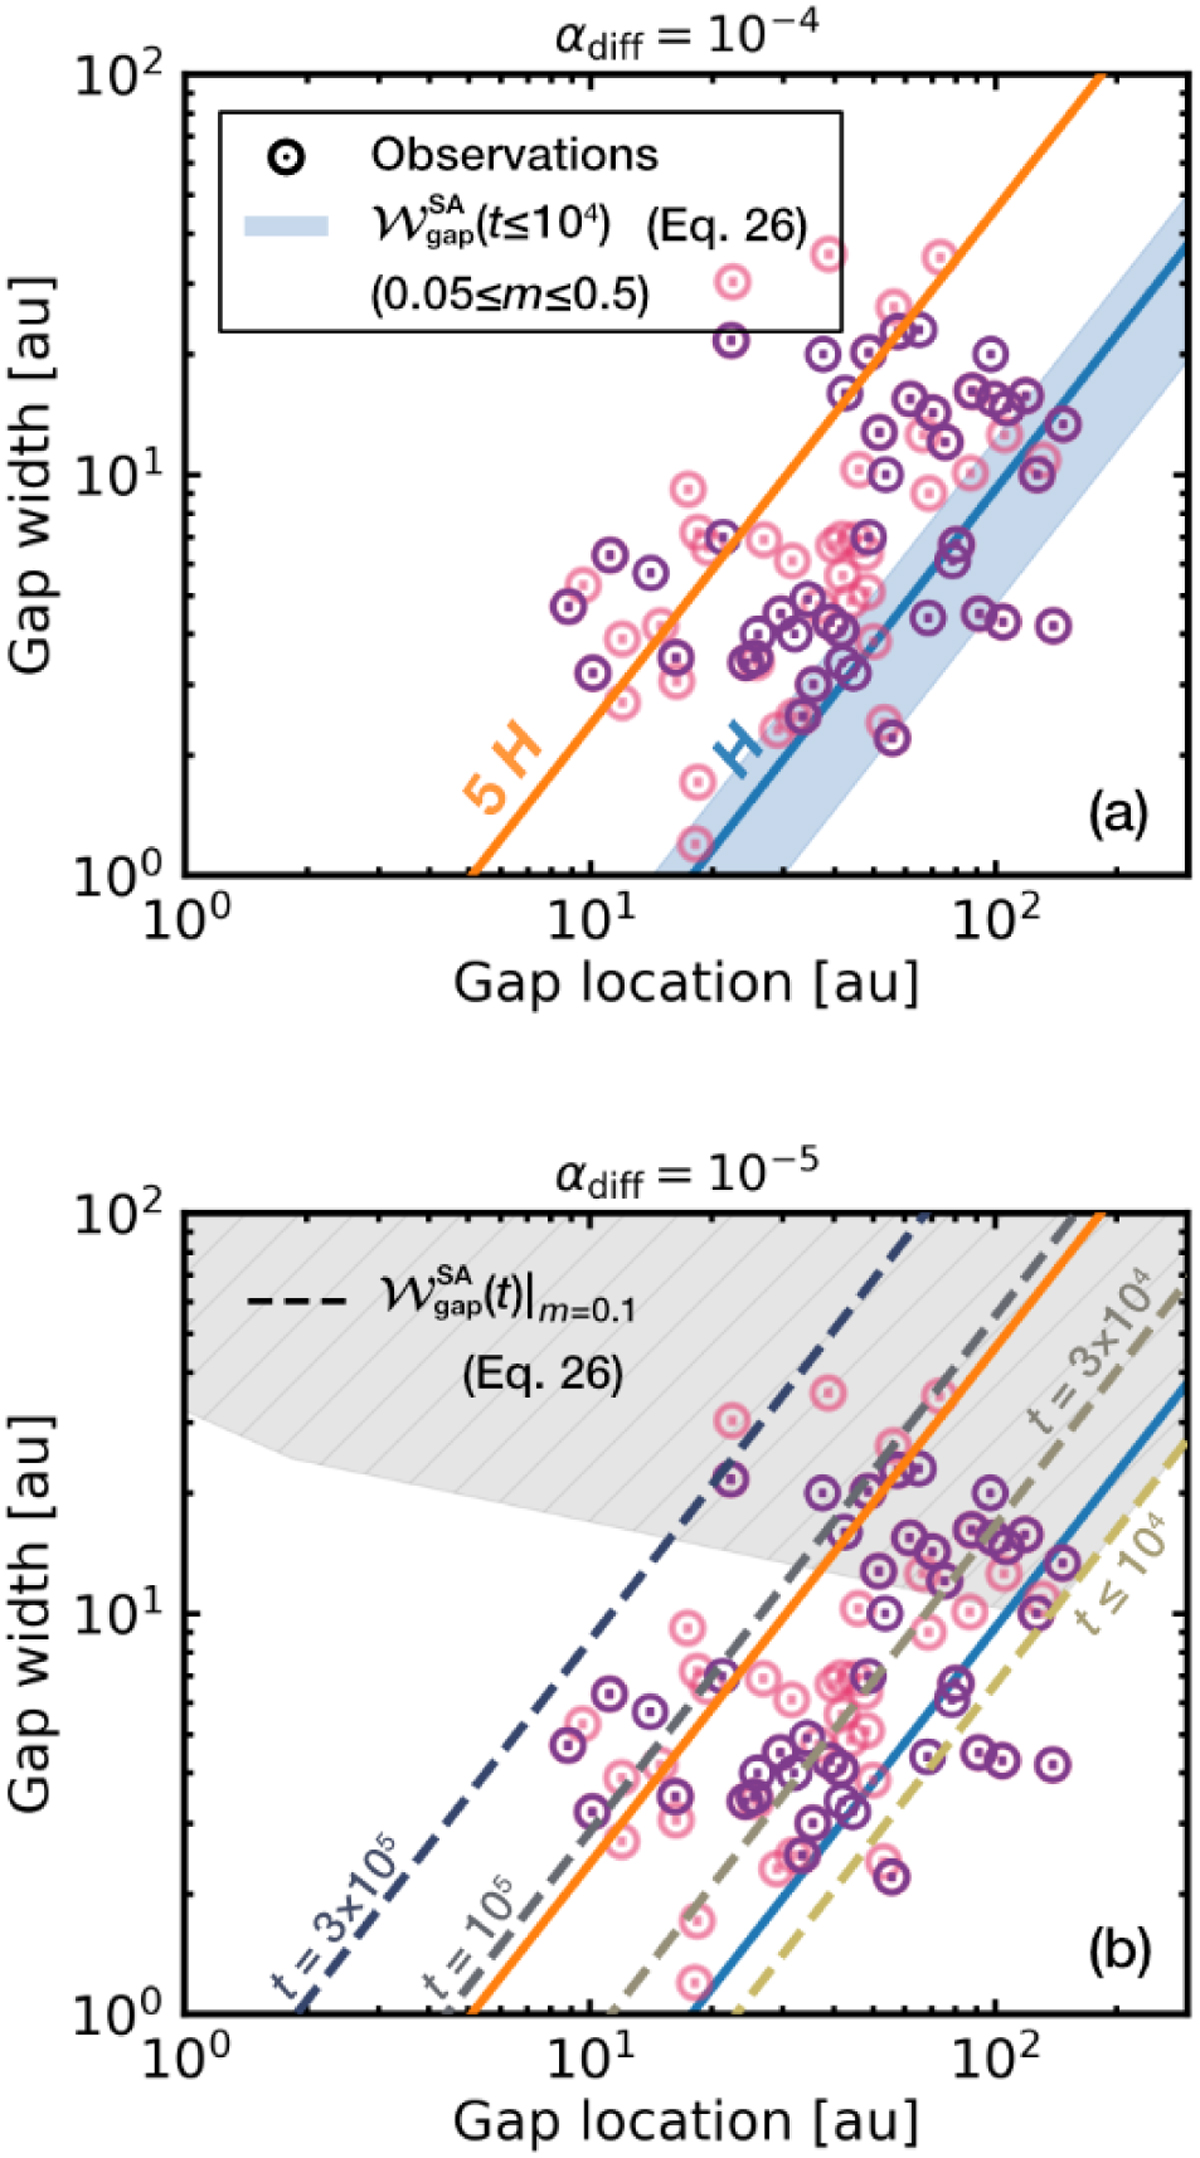
Dust gap width as a function of the dust gap location. We set St = 10−3 and ℳhw = 0.03, and varied the turbulent parameter in each panel, αdiff = 10−4 (panel a) and αdiff = 10−5 (panel b). The blue and orange solid lines denote H and 5 H, respectively (Eq. (A.3)). Panel a: Blue shaded region given by ![]() (Eq. (26)) at t ≤ 104. The lower and upper limits were set by m = 0.05 and 0.5, respectively. Panel b: Dashed lines given by Eq. (26) with a fixed planetary mass, m = 0.1 . The different colors correspond to different times, t ≤ 104, t = 3 × 10⁴, 105, and 3 × 10⁵, respectively. We hatched the region in which the time required for gap formation exceeds 3 Myr for the assumed dimensionless time, t. The observational data indicated with pink and purple markers show the observed gaps that are accompanied by a ring, taken from Zhang et al. (2023) (compiled from Huang et al. (2018); Long et al. (2018), and Zhang et al. (2023)) and Huang et al. (2018) (DSHARP sample), respectively. These samples do not include disks with inner dust cavities.
(Eq. (26)) at t ≤ 104. The lower and upper limits were set by m = 0.05 and 0.5, respectively. Panel b: Dashed lines given by Eq. (26) with a fixed planetary mass, m = 0.1 . The different colors correspond to different times, t ≤ 104, t = 3 × 10⁴, 105, and 3 × 10⁵, respectively. We hatched the region in which the time required for gap formation exceeds 3 Myr for the assumed dimensionless time, t. The observational data indicated with pink and purple markers show the observed gaps that are accompanied by a ring, taken from Zhang et al. (2023) (compiled from Huang et al. (2018); Long et al. (2018), and Zhang et al. (2023)) and Huang et al. (2018) (DSHARP sample), respectively. These samples do not include disks with inner dust cavities.
Current usage metrics show cumulative count of Article Views (full-text article views including HTML views, PDF and ePub downloads, according to the available data) and Abstracts Views on Vision4Press platform.
Data correspond to usage on the plateform after 2015. The current usage metrics is available 48-96 hours after online publication and is updated daily on week days.
Initial download of the metrics may take a while.