Fig. 5
Download original image
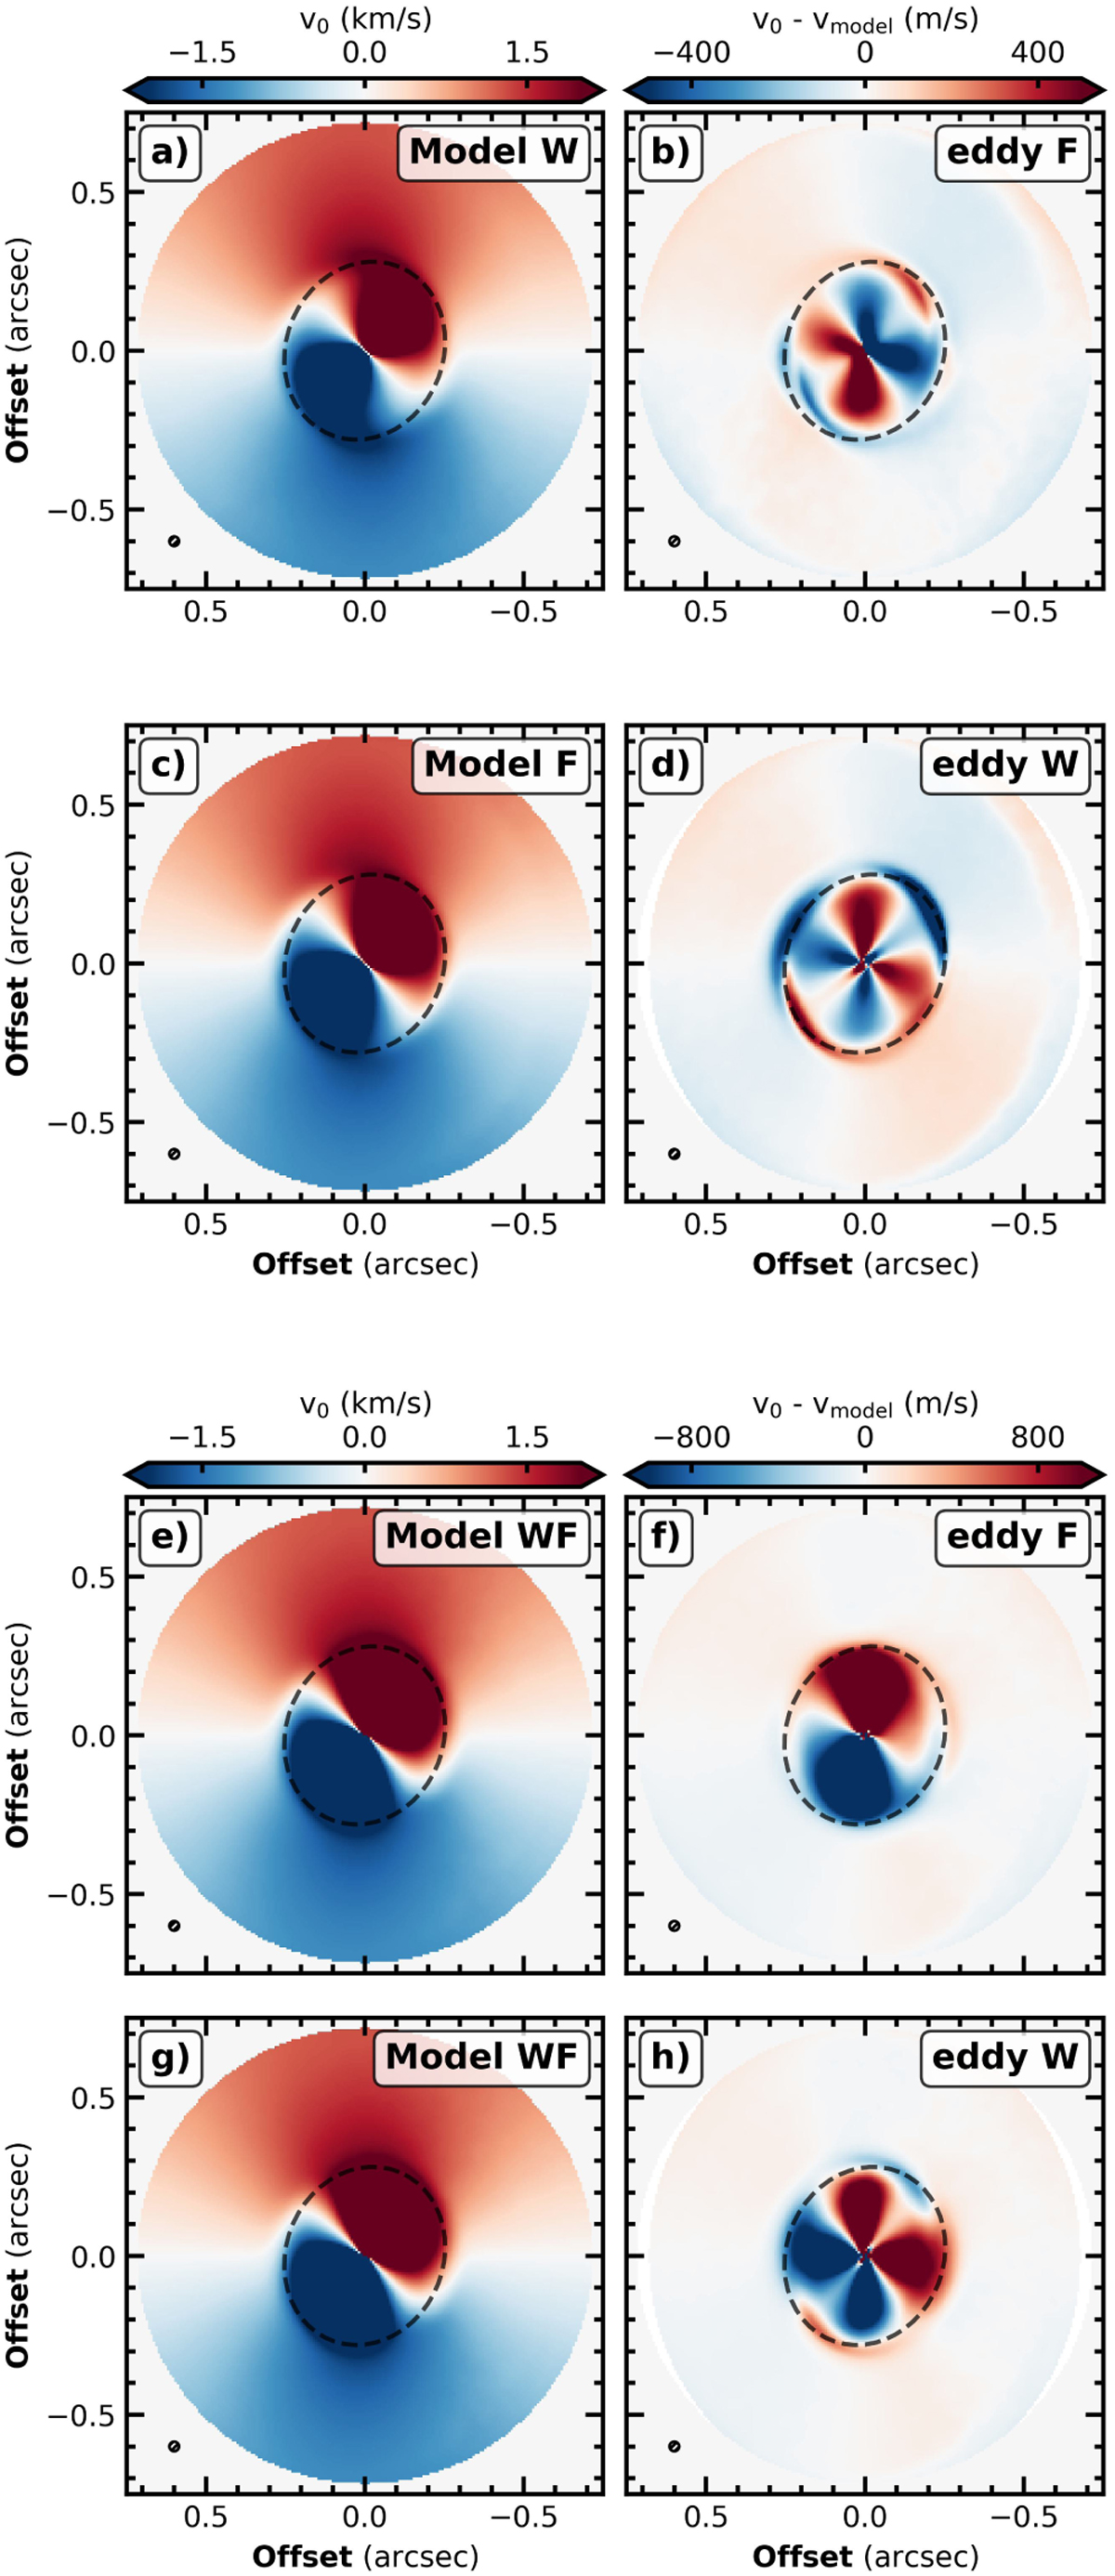
Displaying v0 galleries for various model types. The left column exhibits synthetic v0 maps, with model types labeled in the top right corner. The right column displays residuals after subtraction of the best-fit model, also labeled in the top right corner. Beam size is denoted in the lower left corner of each peach panel. The black dashed line represents the radius at which the transition occurs.
Current usage metrics show cumulative count of Article Views (full-text article views including HTML views, PDF and ePub downloads, according to the available data) and Abstracts Views on Vision4Press platform.
Data correspond to usage on the plateform after 2015. The current usage metrics is available 48-96 hours after online publication and is updated daily on week days.
Initial download of the metrics may take a while.