Open Access
Fig. 3
Download original image
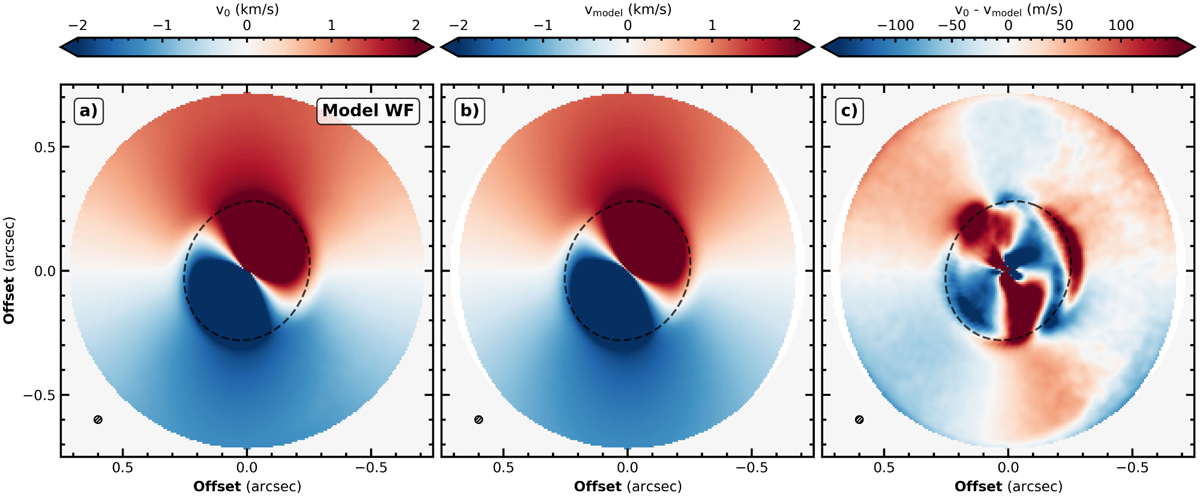
Velocity map v0 for Model WF, along with its corresponding best-fit and residual maps. In each panel the beam size is indicated in the lower left corner. The black dashed line represents the radius at which the transition occurs.
Current usage metrics show cumulative count of Article Views (full-text article views including HTML views, PDF and ePub downloads, according to the available data) and Abstracts Views on Vision4Press platform.
Data correspond to usage on the plateform after 2015. The current usage metrics is available 48-96 hours after online publication and is updated daily on week days.
Initial download of the metrics may take a while.