Fig. 9
Download original image
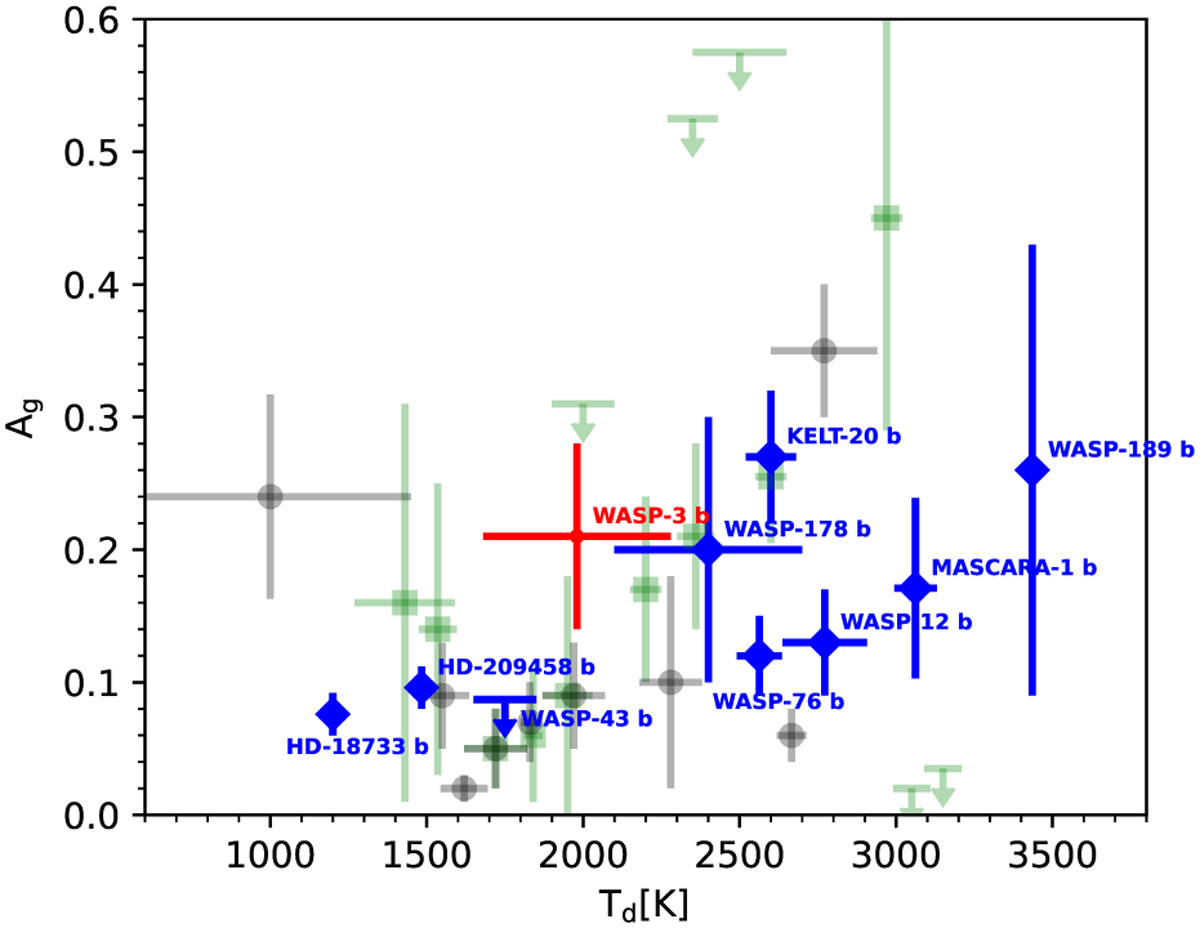
Relationship between Ag and Td, adapted from Fig. 10 in Wong et al. (2021) and including our analysis of WASP-3 b (in red). The green squares indicate the systems from the first and second year of the TESS primary mission. The black circles indicate the Kepler/CoRoT-band geometric albedos for the targets that were observed by those missions. Blue symbols are other targets from the CHEOPS GTO program (Lendl et al. 2020; Hooton et al. 2022; Brandeker et al. 2022; Singh et al. 2022; Scandariato et al. 2022; Krenn et al. 2023; Pagano et al. 2024; Akinsanmi et al. 2024; Demangeon et al. 2024).
Current usage metrics show cumulative count of Article Views (full-text article views including HTML views, PDF and ePub downloads, according to the available data) and Abstracts Views on Vision4Press platform.
Data correspond to usage on the plateform after 2015. The current usage metrics is available 48-96 hours after online publication and is updated daily on week days.
Initial download of the metrics may take a while.