Fig. 5
Download original image
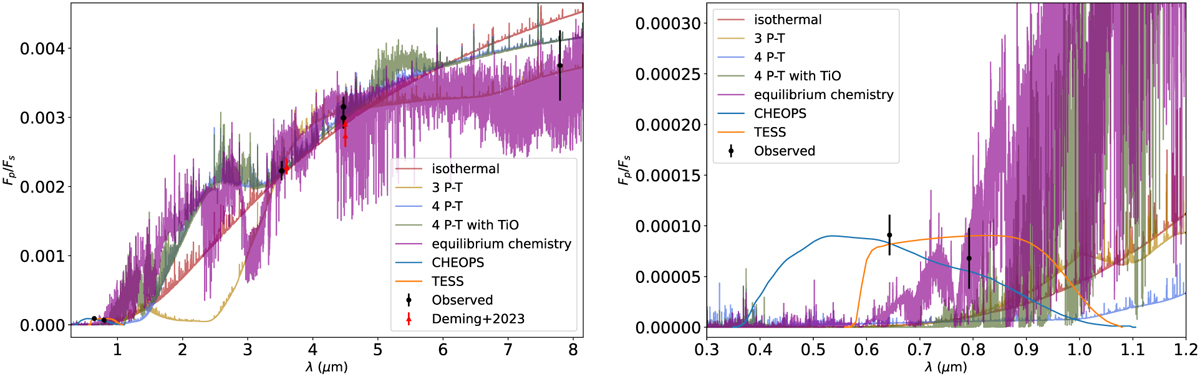
Emission spectra with different model assumptions. Left: all the best-fit models we performed in this work. The black points represent the observations with TESS, CHEOPS, and Spitzer, while red points show the measurements by Deming et al. (2023). Right: zoomed-in view of the optical wavelength, together with the TESS and CHEOPS observations and bandpasses.
Current usage metrics show cumulative count of Article Views (full-text article views including HTML views, PDF and ePub downloads, according to the available data) and Abstracts Views on Vision4Press platform.
Data correspond to usage on the plateform after 2015. The current usage metrics is available 48-96 hours after online publication and is updated daily on week days.
Initial download of the metrics may take a while.