Fig. 4
Download original image
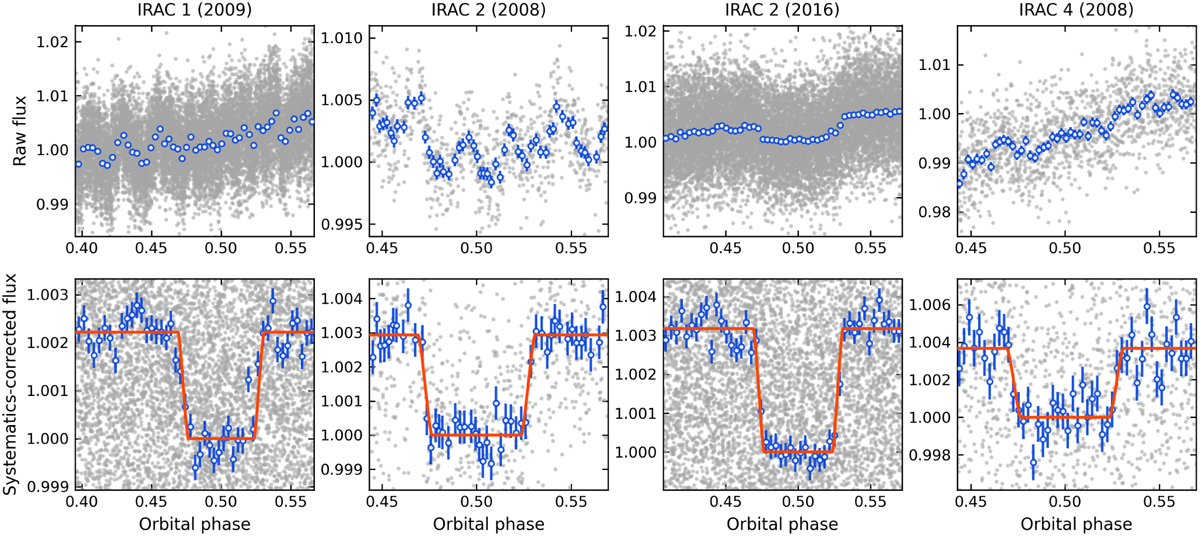
Normalized Spitzer LCs of WASP-3 after the raw aperture-photometry extraction (top panels) and after removing instrumental systematics from the joint LC fit (bottom panels). The gray markers show the flux of the individual frames, whereas the blue markers show the binned fluxes and their uncertainties. The red curves in the bottom panels show the best-fit eclipse model for each observation.
Current usage metrics show cumulative count of Article Views (full-text article views including HTML views, PDF and ePub downloads, according to the available data) and Abstracts Views on Vision4Press platform.
Data correspond to usage on the plateform after 2015. The current usage metrics is available 48-96 hours after online publication and is updated daily on week days.
Initial download of the metrics may take a while.