Fig. 3
Download original image
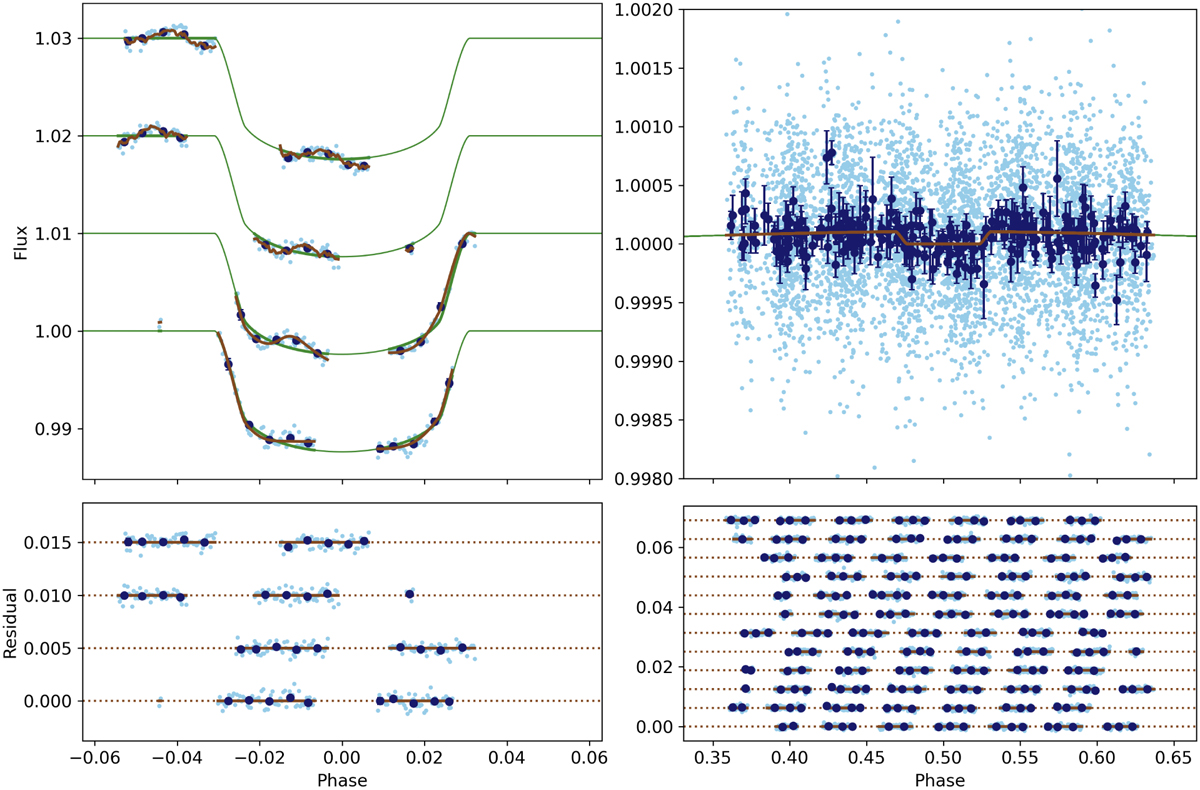
CHEOPS LC of WASP-3 and our best-fit model for the transits and eclipses. Upper-left panel: observed transit LCs (in cyan) offset vertically by multiples of 0.01 units. The dark blue points are the data points binned over 0.01 phase units. The full model, which includes instrumental trends, is shown in brown, and the transit model without trends is shown in green. Lower-left panel: residuals from the best-fit model to the transit LCs offset vertically by multiples of 0.005 units. Upper-right panel: Secondary eclipse LCs after removal of instrumental noise from our best-fit model, plotted without any vertical offset. Lower-right panel: residuals from the best-fit model to the secondary eclipses offset vertically by multiples of 0.005 units.
Current usage metrics show cumulative count of Article Views (full-text article views including HTML views, PDF and ePub downloads, according to the available data) and Abstracts Views on Vision4Press platform.
Data correspond to usage on the plateform after 2015. The current usage metrics is available 48-96 hours after online publication and is updated daily on week days.
Initial download of the metrics may take a while.