Open Access
Fig. 1
Download original image
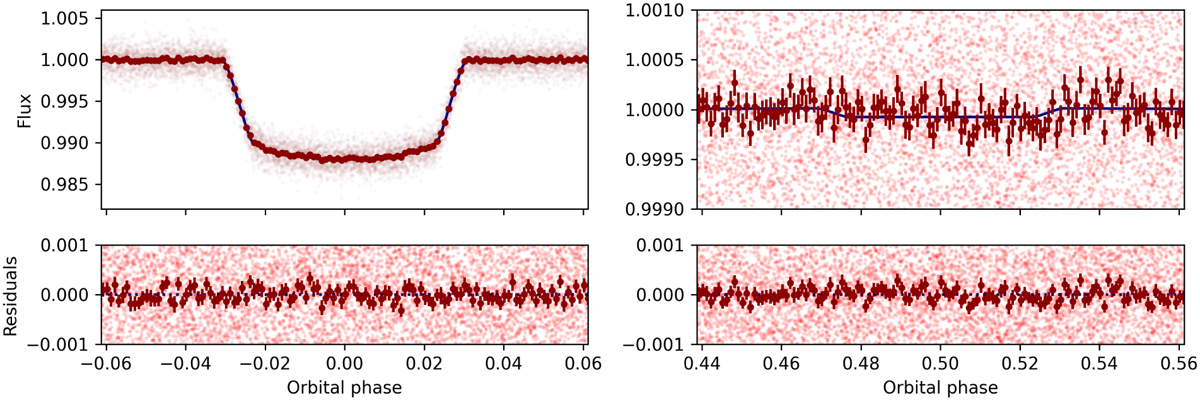
Phase-folded TESS LC of WASP-3 (pale red points) centered on the planetary transit (left column) and secondary eclipses (right column). Our best-fit model is shown with a dark blue line. The dark red points show the mean value of the observations and residuals in bins of 0.001 phase units (160 s).
Current usage metrics show cumulative count of Article Views (full-text article views including HTML views, PDF and ePub downloads, according to the available data) and Abstracts Views on Vision4Press platform.
Data correspond to usage on the plateform after 2015. The current usage metrics is available 48-96 hours after online publication and is updated daily on week days.
Initial download of the metrics may take a while.