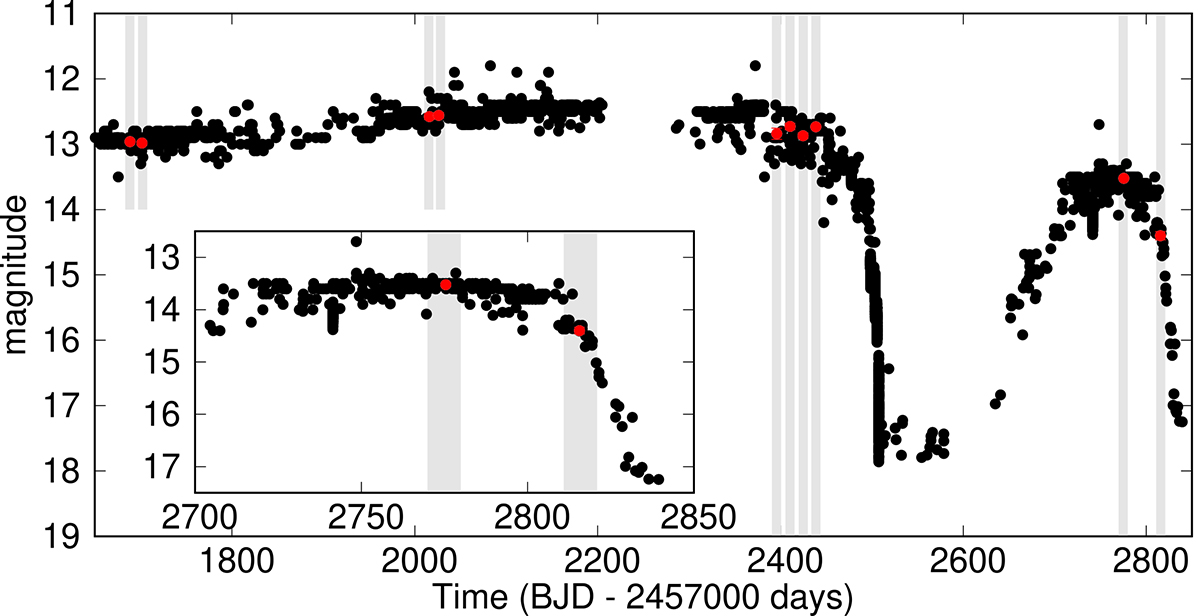
Fig. 5.
Download original image
AAVSO light curve of MV Lyr with observation intervals of TESS marked by shaded grey areas. The inset panel shows in detail the two most recent TESS observations falling before and at the beginning of the decline from the high optical state. The red points are the mean brightness of the AAVSO data during the TESS observations.
Current usage metrics show cumulative count of Article Views (full-text article views including HTML views, PDF and ePub downloads, according to the available data) and Abstracts Views on Vision4Press platform.
Data correspond to usage on the plateform after 2015. The current usage metrics is available 48-96 hours after online publication and is updated daily on week days.
Initial download of the metrics may take a while.