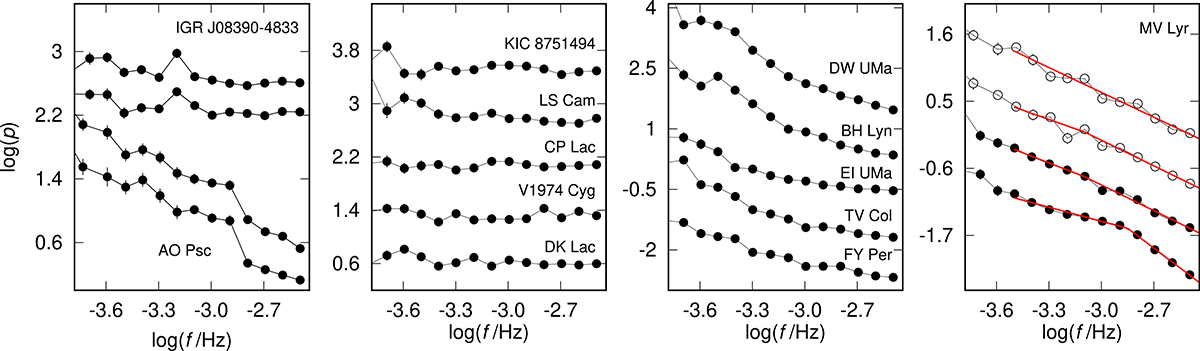
Fig. 2.
Download original image
Examples of PDSs. The black points represent PDSs with nd = 10 and black circles are for nd = 5. First (left) panel: IPs with a strong spin frequency affecting the PDS. Second panel: Example of PDSs dominated by white noise. Third panel: Example of PDSs dominated by red noise. Fourth (right) panel: Examples of PDSs of MV Lyr with broken power law fits. The upper PDS shows the case in which the fitting process did not converge on the broken power law shape. There is no fb but a straight line instead. The middle two cases represent a possible positive detection but with an fb error larger than 0.10. Apparently, the fb is not clear even if the fit converges. The lower case is an example of a positive detection with a small-enough error of the fb due to the clear broken power law shape of the PDS. Individual PDSs are offset vertically for better visualisation.
Current usage metrics show cumulative count of Article Views (full-text article views including HTML views, PDF and ePub downloads, according to the available data) and Abstracts Views on Vision4Press platform.
Data correspond to usage on the plateform after 2015. The current usage metrics is available 48-96 hours after online publication and is updated daily on week days.
Initial download of the metrics may take a while.