Fig. 9
Download original image
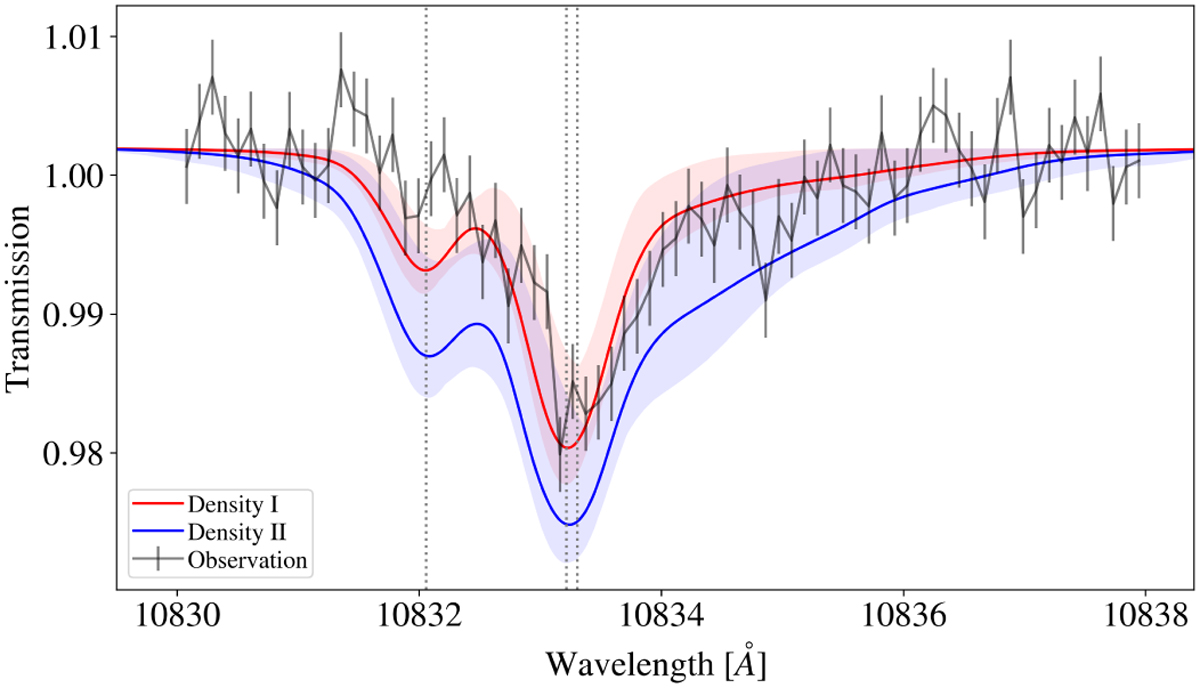
Synthetic transmission spectra derived from our 3D simulation for the density I (red solid line) and density II (blue solid line) setups. As for the underlying observations (gray), a time average between the optical second and third transit contact is displayed. The shaded regions represent the range of model transmission spectra obtained during the transit. The synthetic spectra are multiplied by a factor of 1.00191 (Sect. 3.4.4) to match the observational continuum. The red solid line aligns well with the observed helium triplet, while the location of the secondary red component can be reproduced by considering a higher density of the same outflow structure.
Current usage metrics show cumulative count of Article Views (full-text article views including HTML views, PDF and ePub downloads, according to the available data) and Abstracts Views on Vision4Press platform.
Data correspond to usage on the plateform after 2015. The current usage metrics is available 48-96 hours after online publication and is updated daily on week days.
Initial download of the metrics may take a while.