Open Access
Fig. 7
Download original image
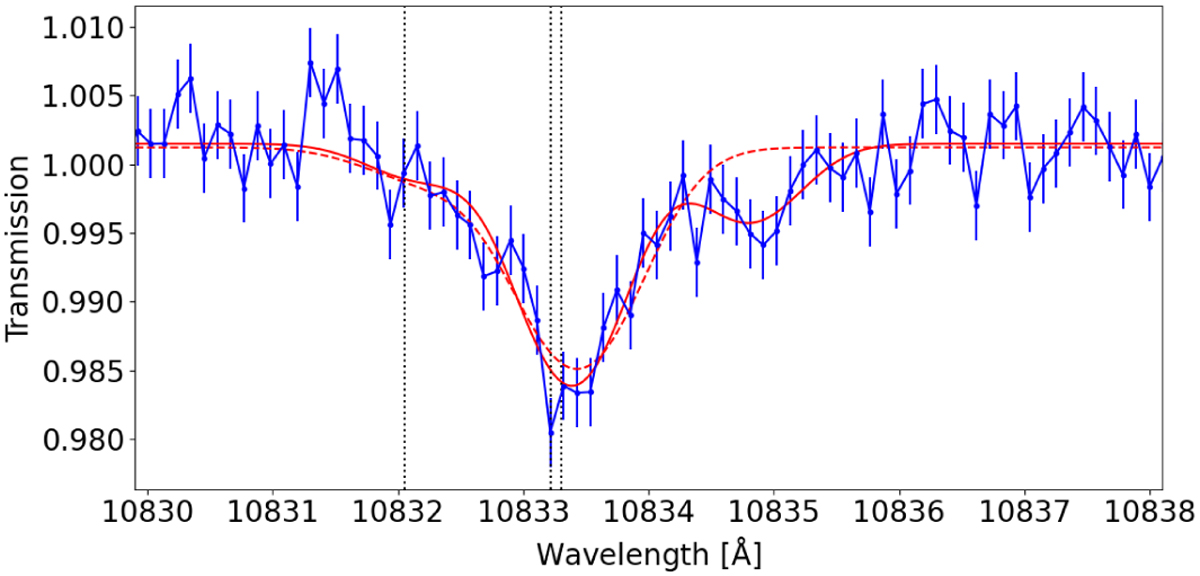
Averaged transmission spectrum between optical second and third contact. The red lines show three best-fit empirical models with 5% filling factor and one (dashed) and two (solid) absorbing components. The vertical dotted lines show the wavelengths of the He I λ10833 triplet lines.
Current usage metrics show cumulative count of Article Views (full-text article views including HTML views, PDF and ePub downloads, according to the available data) and Abstracts Views on Vision4Press platform.
Data correspond to usage on the plateform after 2015. The current usage metrics is available 48-96 hours after online publication and is updated daily on week days.
Initial download of the metrics may take a while.