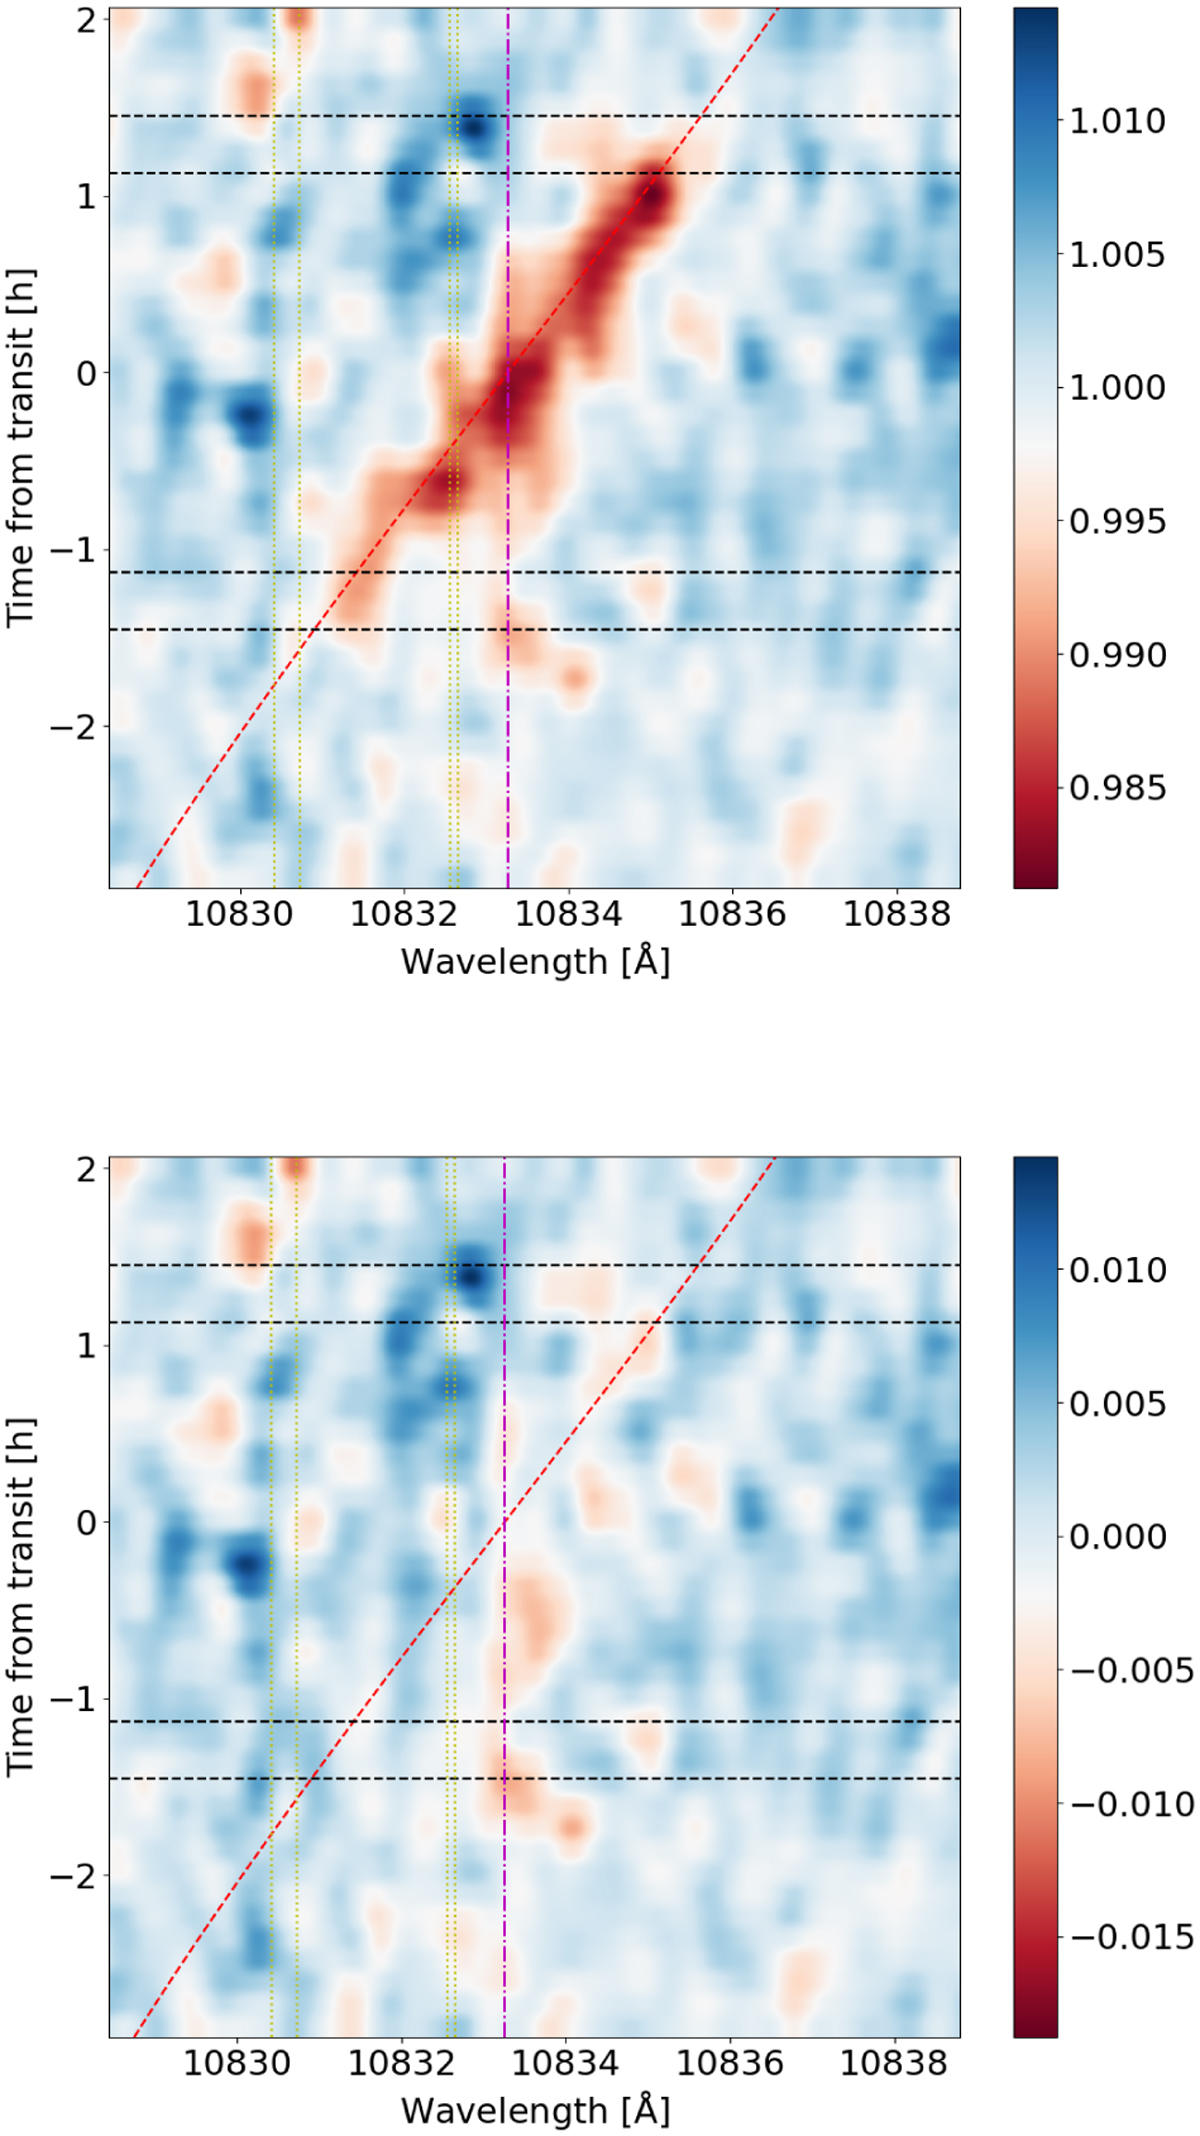
Fig. 4
Download original image
Maps of transmission spectra and residuals (smoothed) of the He I λ10833 region in the stellar reference frame. The top panel shows the observed transmission spectra and the bottom panel the residuals after subtraction of the best-fit model (color coded). The horizontal lines (black dashed) indicate the optical first to fourth contact times, dotted yellow lines (vertical) show the location of the telluric OH line components, the dash-dotted magenta line indicates the wavelength of the stellar He I λ10833 line, and the dashed red line (diagonal) shows the radial velocity track of the planetary orbit.
Current usage metrics show cumulative count of Article Views (full-text article views including HTML views, PDF and ePub downloads, according to the available data) and Abstracts Views on Vision4Press platform.
Data correspond to usage on the plateform after 2015. The current usage metrics is available 48-96 hours after online publication and is updated daily on week days.
Initial download of the metrics may take a while.