Fig. B.2
Download original image
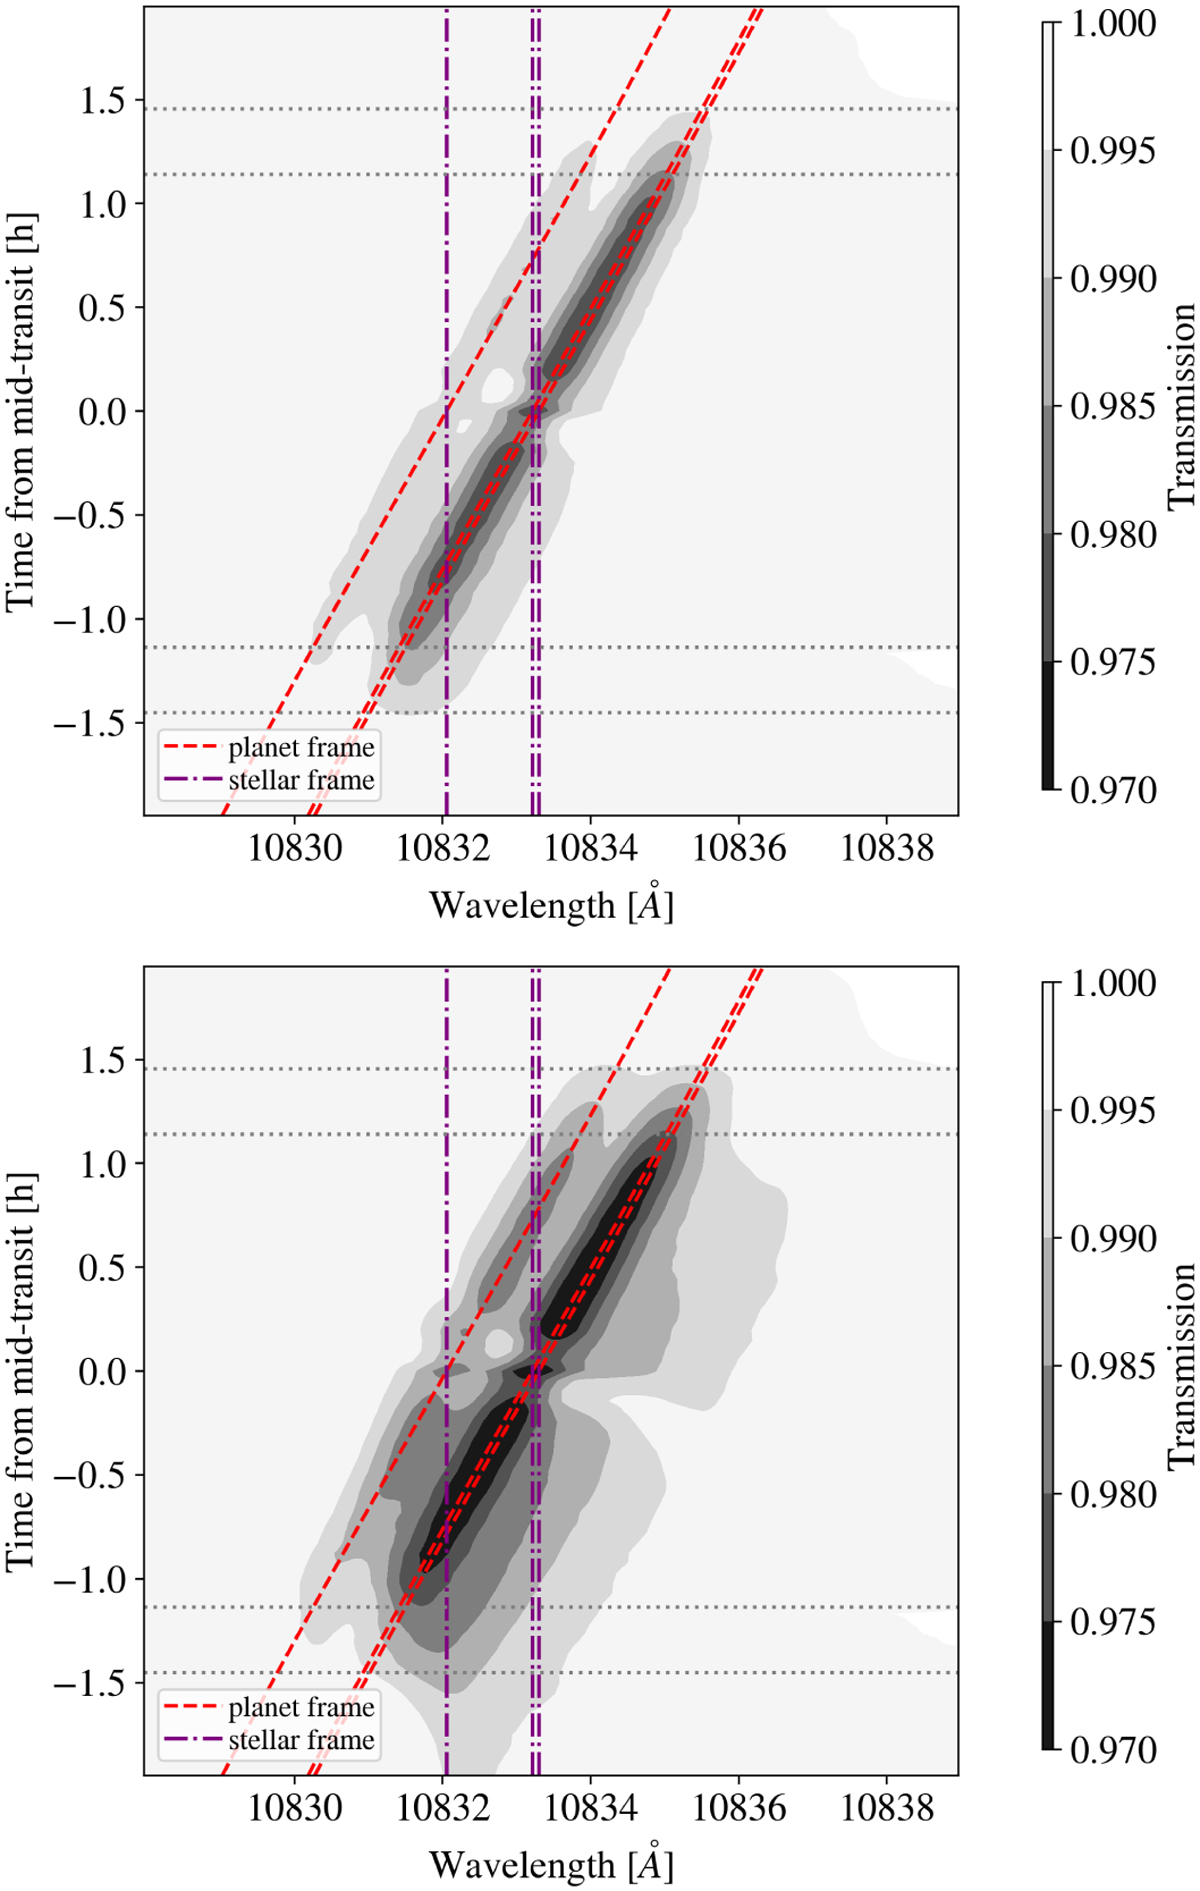
Synthetic spectral time series obtained from the 3D simulations. The top panel displays the spectra from the density I scenario, while the bottom panel shows the spectra from the same snapshot but using a density and pressure by a factor of 2.0 higher (density II). Purple vertical lines represent the stellar rest-frame wavelength of the metastable helium triplet in vacuum, and red tilted lines denote the planetary rest frame. Horizontal dotted lines indicate the transit contact points. The gray color map illustrates the transmission of the spectra, consistently following the planetary rest frame during the transit in both scenarios. In the higher density case (bottom), the contribution of the secondary red-shifted component becomes visible even during pre-transit phases.
Current usage metrics show cumulative count of Article Views (full-text article views including HTML views, PDF and ePub downloads, according to the available data) and Abstracts Views on Vision4Press platform.
Data correspond to usage on the plateform after 2015. The current usage metrics is available 48-96 hours after online publication and is updated daily on week days.
Initial download of the metrics may take a while.