Fig. B.1
Download original image
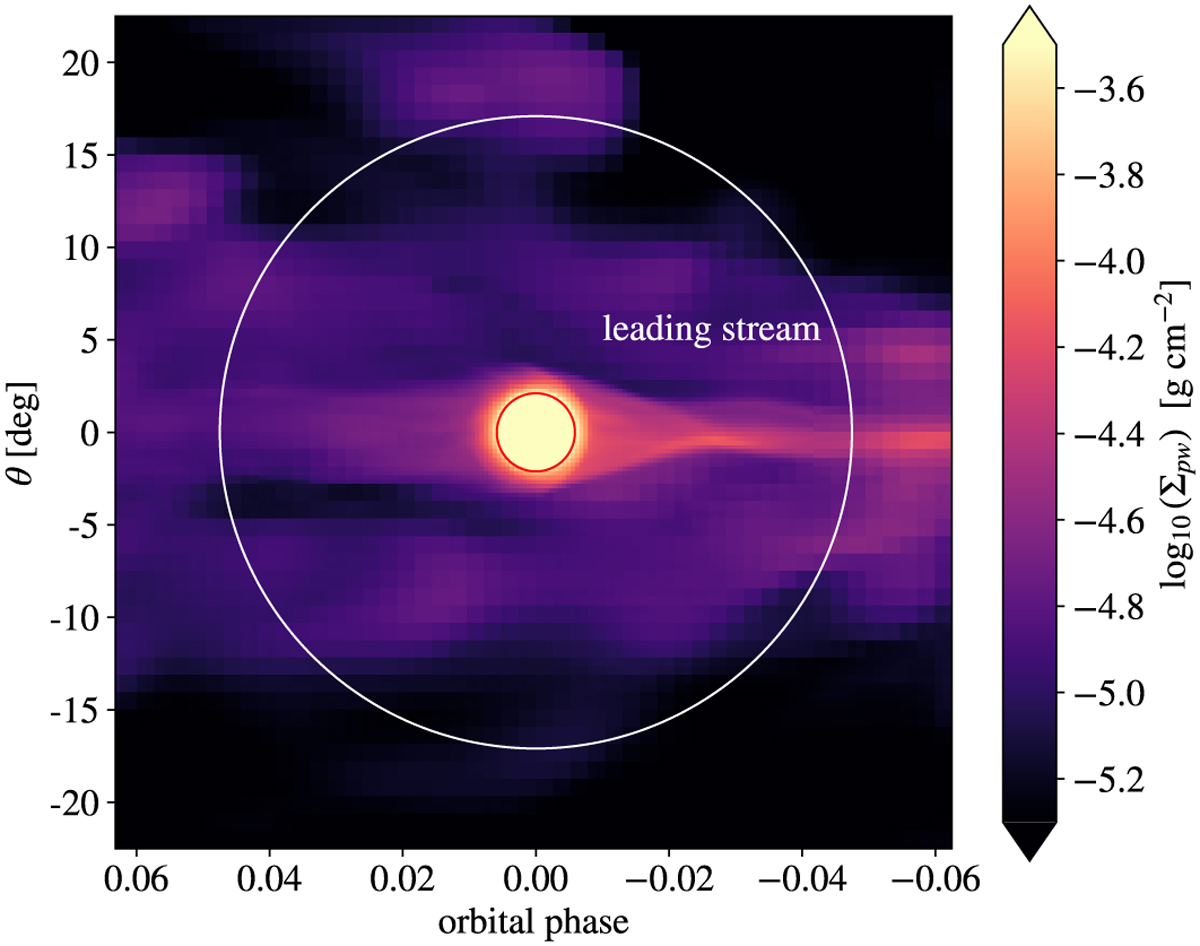
Projected surface density of the planetary wind as seen by the observer. The planet moves from left to right, with the leading stream being observed during negative orbital phases. The red circle represents the angular size of the planet and the white circle the angular size of the stellar disk, and thus the gas probed during mid-transit. In the leading stream, at phase -0.03, the gas converges and flares out again. In this high-density region, the gas is moving away from the observer, resulting in a redshifted spectral feature.
Current usage metrics show cumulative count of Article Views (full-text article views including HTML views, PDF and ePub downloads, according to the available data) and Abstracts Views on Vision4Press platform.
Data correspond to usage on the plateform after 2015. The current usage metrics is available 48-96 hours after online publication and is updated daily on week days.
Initial download of the metrics may take a while.