Fig. 11
Download original image
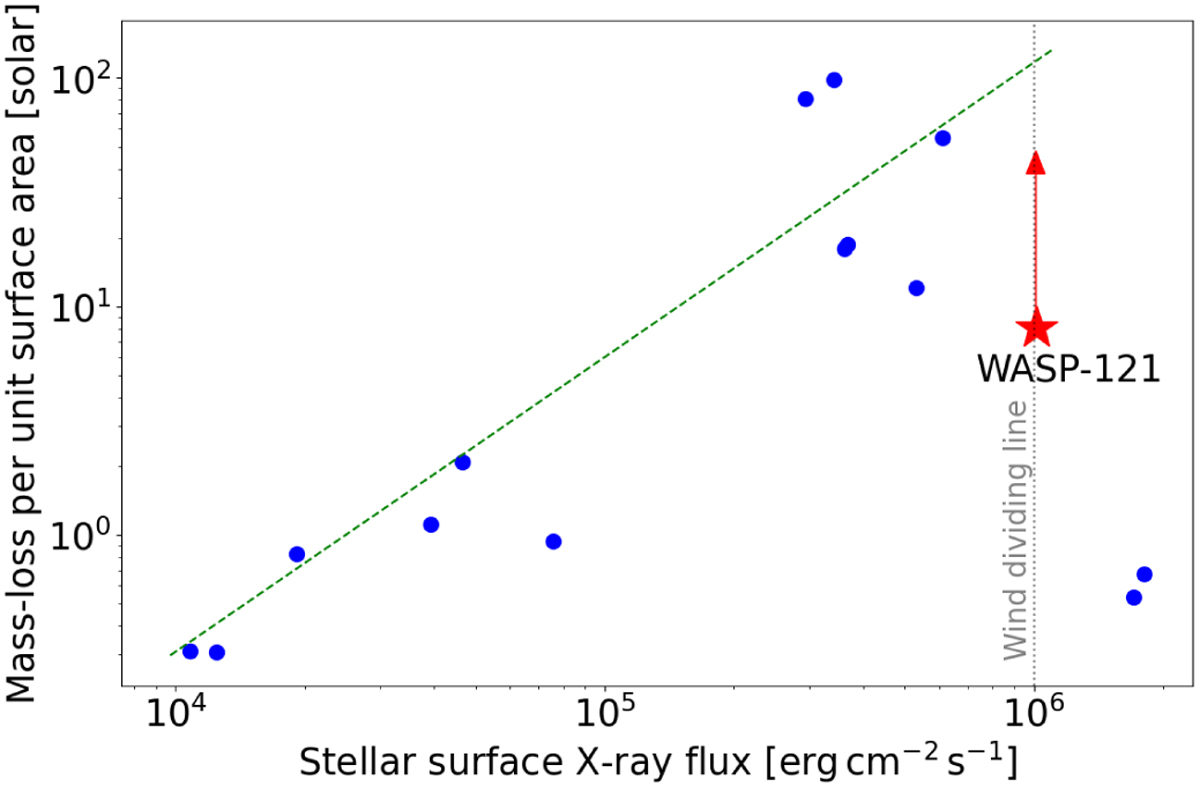
Stellar wind mass loss rates per unit surface area in solar units as a function of the stellar surface X-ray flux for a sample of K- and G-type dwarfs (blue circles, adopted from Wood et al. 2014; Wood 2018). The dashed green line shows a power law relation of the form ![]() and the vertical line indicates the wind dividing line. The red star shows our wind mass loss estimate for WASP-121, which we consider a lower limit.
and the vertical line indicates the wind dividing line. The red star shows our wind mass loss estimate for WASP-121, which we consider a lower limit.
Current usage metrics show cumulative count of Article Views (full-text article views including HTML views, PDF and ePub downloads, according to the available data) and Abstracts Views on Vision4Press platform.
Data correspond to usage on the plateform after 2015. The current usage metrics is available 48-96 hours after online publication and is updated daily on week days.
Initial download of the metrics may take a while.