Open Access
Fig. 1
Download original image
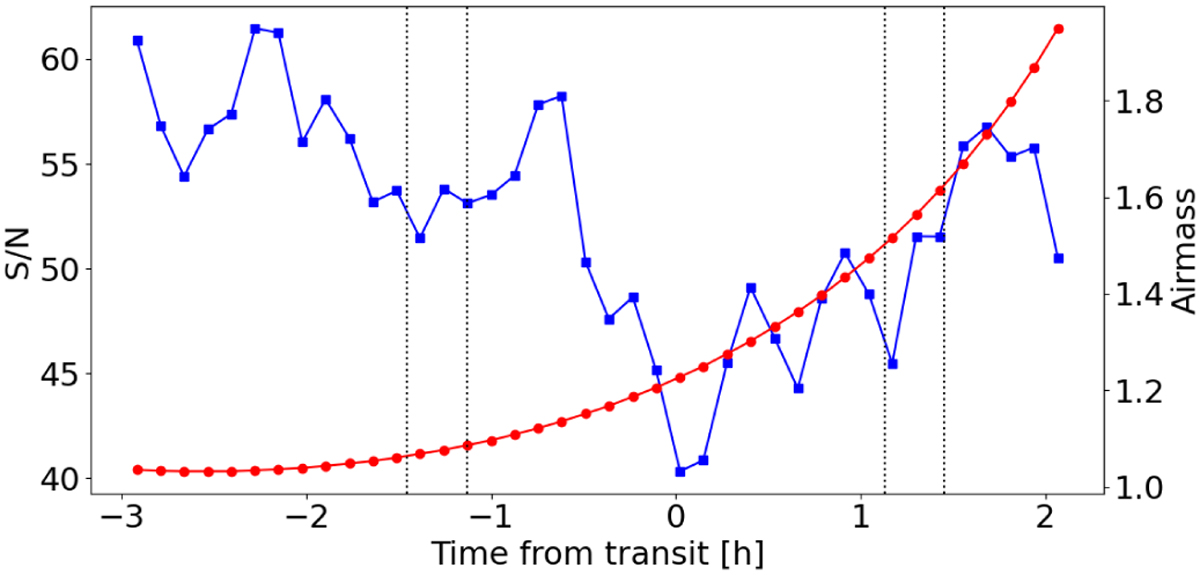
Mean S/N per spectral bin (blue squares) in the 10 830–10 840 Å range and the airmass (red circles) for the spectral time series. Vertical dotted lines indicate the optical first to fourth contact.
Current usage metrics show cumulative count of Article Views (full-text article views including HTML views, PDF and ePub downloads, according to the available data) and Abstracts Views on Vision4Press platform.
Data correspond to usage on the plateform after 2015. The current usage metrics is available 48-96 hours after online publication and is updated daily on week days.
Initial download of the metrics may take a while.