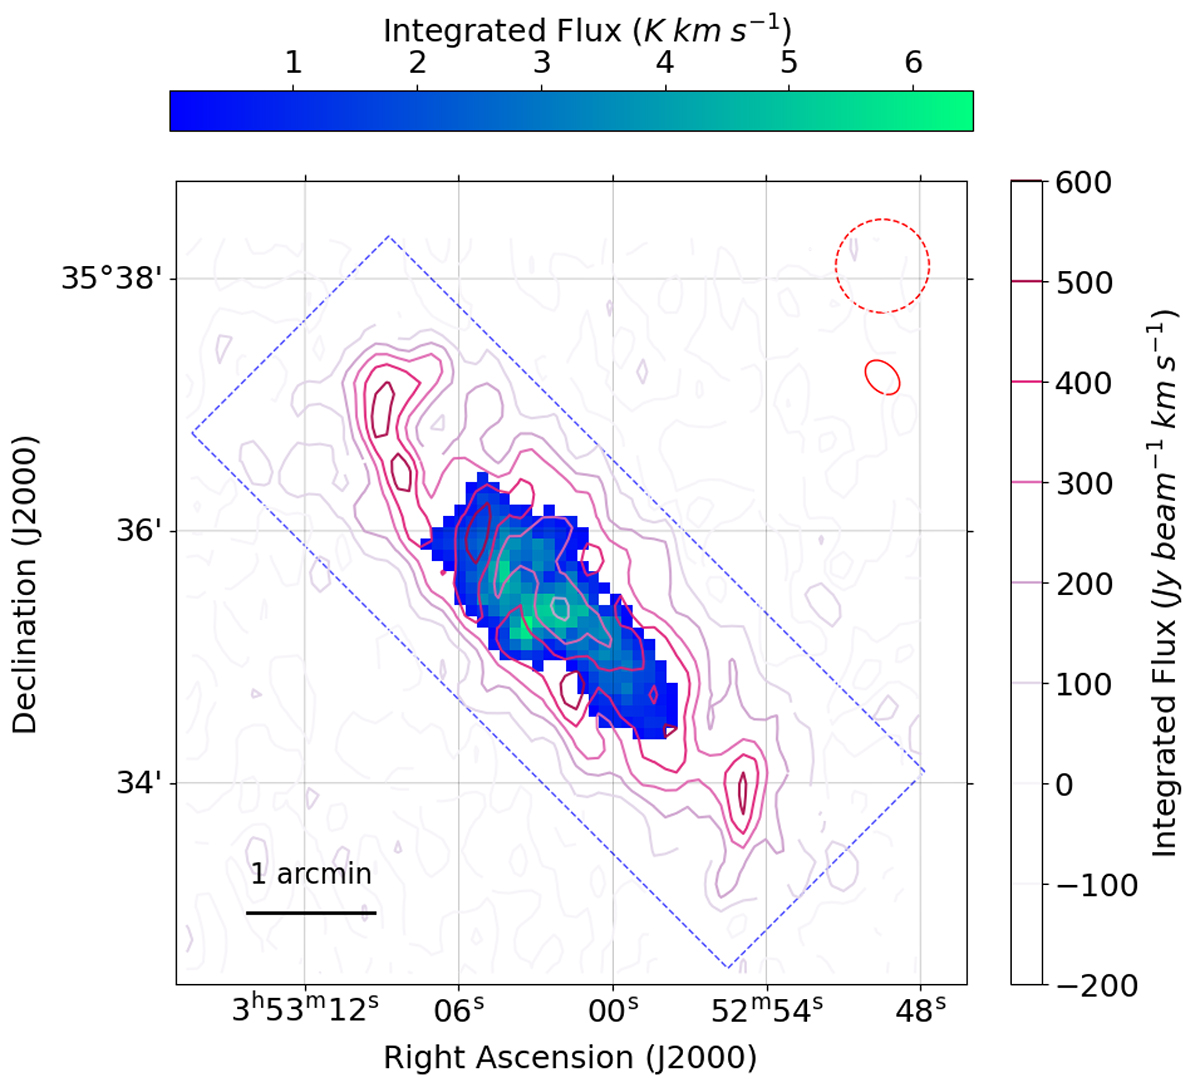
Fig. 8.
Download original image
Distribution of H I emission in UGC 2885 from the WSRT data (red contours). Each increment represents 100 Jy beam−1 km s−1. The background filled map is the integrated flux (moment-0) from the IRAM datacube. The blue box is as described in Fig. 6. The dashed red circle is the IRAM beam size, and the solid red ellipse is the WSRT beam size (13 × 19 arcsec).
Current usage metrics show cumulative count of Article Views (full-text article views including HTML views, PDF and ePub downloads, according to the available data) and Abstracts Views on Vision4Press platform.
Data correspond to usage on the plateform after 2015. The current usage metrics is available 48-96 hours after online publication and is updated daily on week days.
Initial download of the metrics may take a while.