Fig. 6.
Download original image
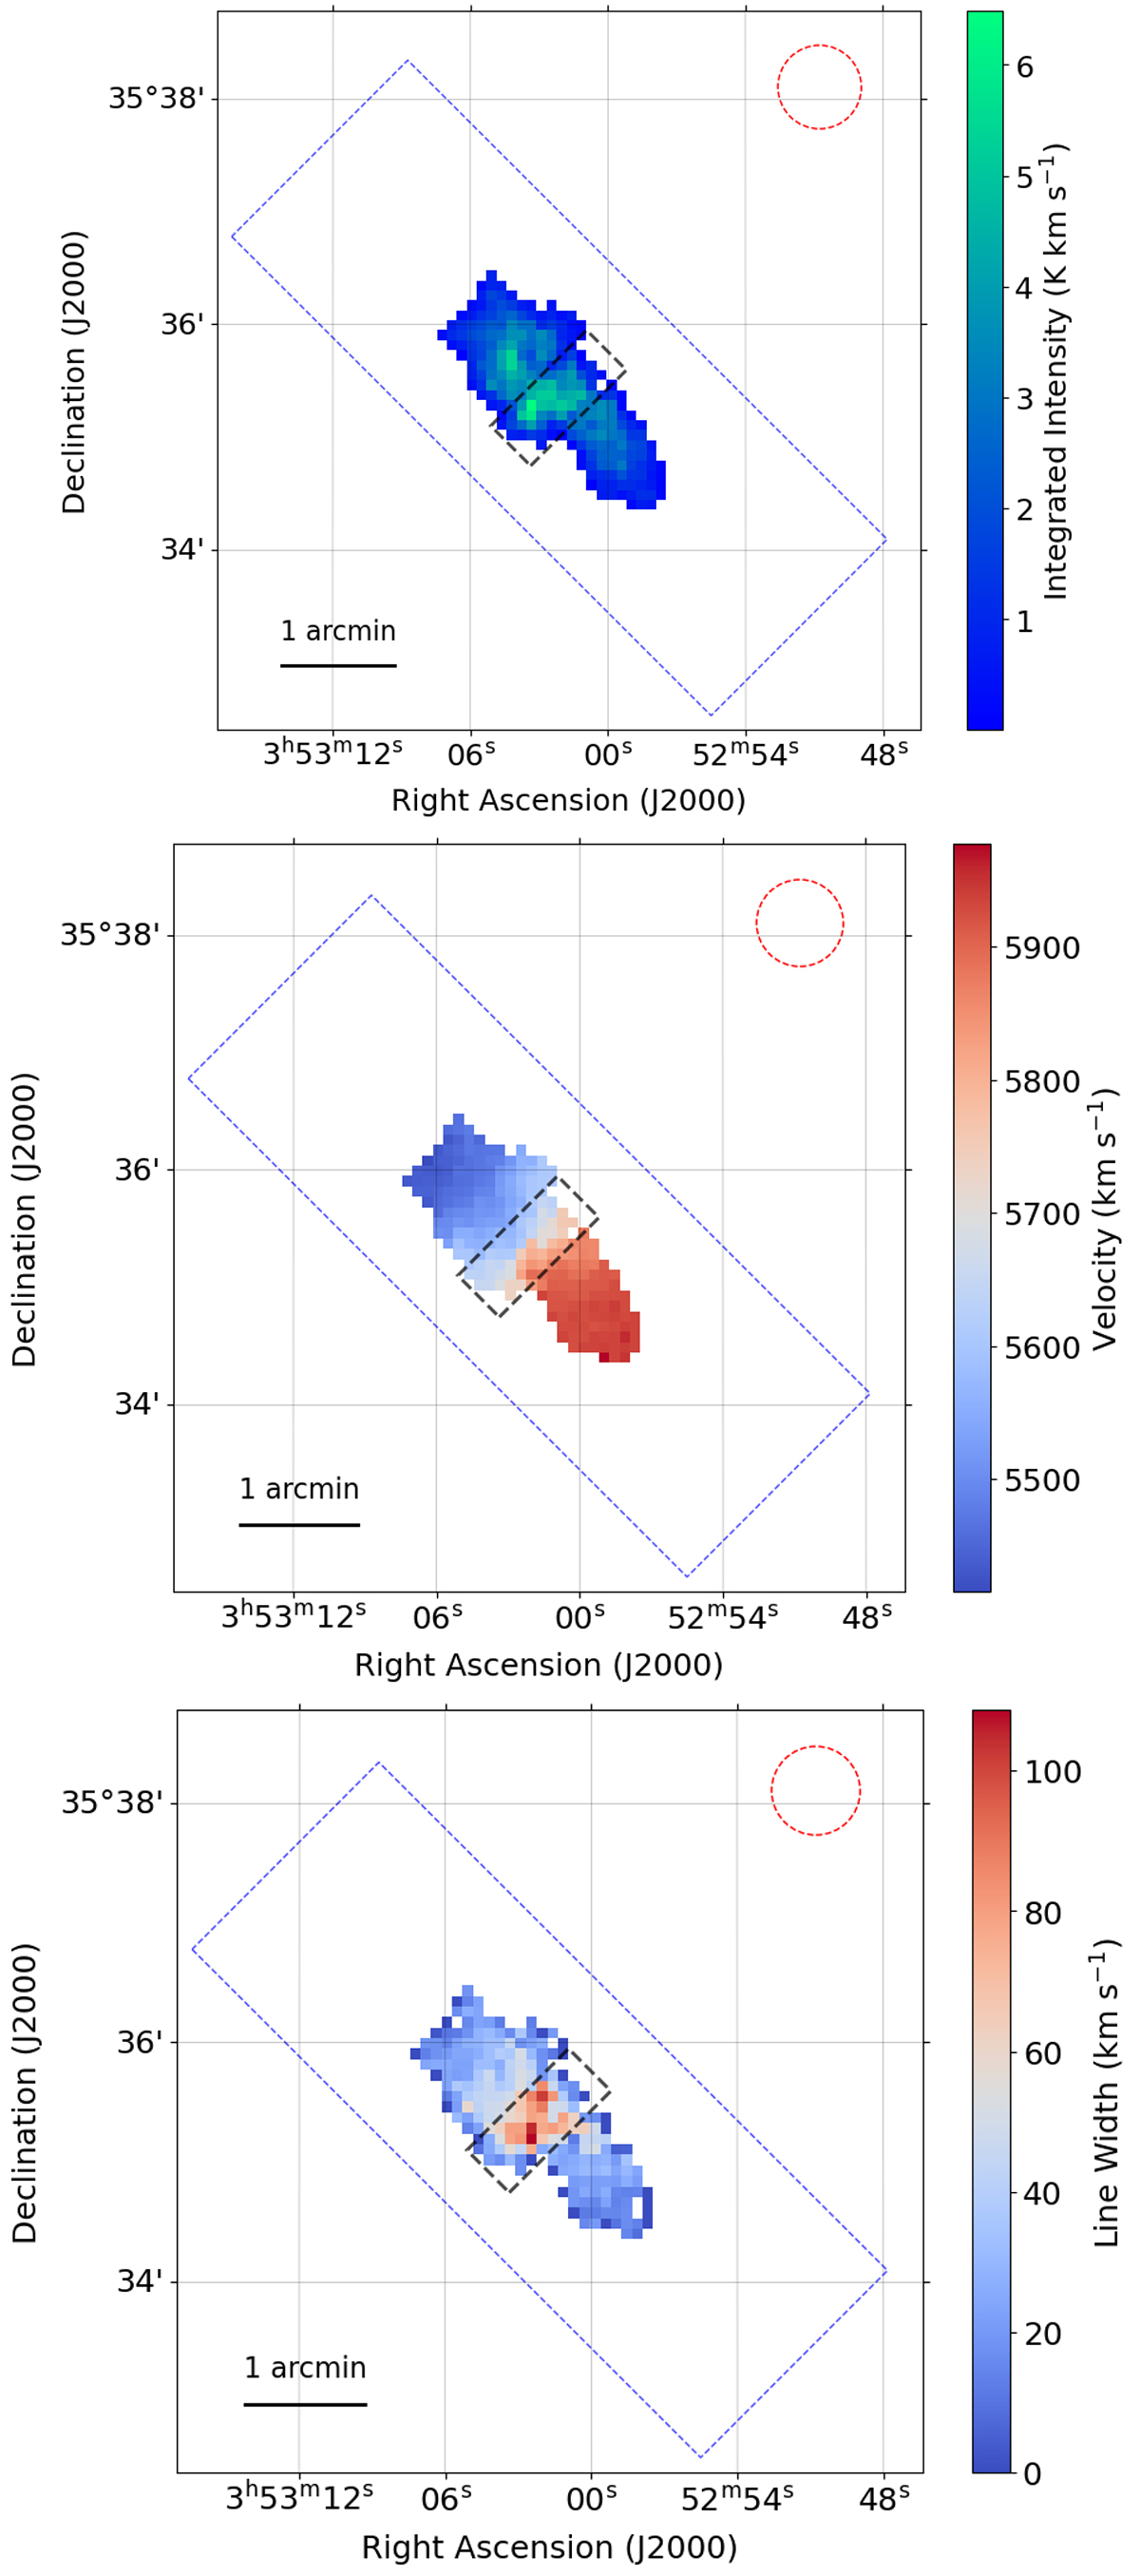
CO moment maps of UGC 2885 from the IRAM datacube. Top: Moment-0 (integrated intensity) map. Middle: Moment-1 (intensity-weighted velocity) map. Bottom: Moment-2 (square root of the intensity-weighted dispersion, or line width) map. The dashed box in all panels highlights the central region. The box is ![]() in length,
in length, ![]() in width, and is positioned at the central pixel of the image. The central distribution of molecular gas is discussed further in Sect. 6.9. The blue box represents the edges of the CO(1−0) datacube. The dashed red circle is the IRAM beam size.
in width, and is positioned at the central pixel of the image. The central distribution of molecular gas is discussed further in Sect. 6.9. The blue box represents the edges of the CO(1−0) datacube. The dashed red circle is the IRAM beam size.
Current usage metrics show cumulative count of Article Views (full-text article views including HTML views, PDF and ePub downloads, according to the available data) and Abstracts Views on Vision4Press platform.
Data correspond to usage on the plateform after 2015. The current usage metrics is available 48-96 hours after online publication and is updated daily on week days.
Initial download of the metrics may take a while.