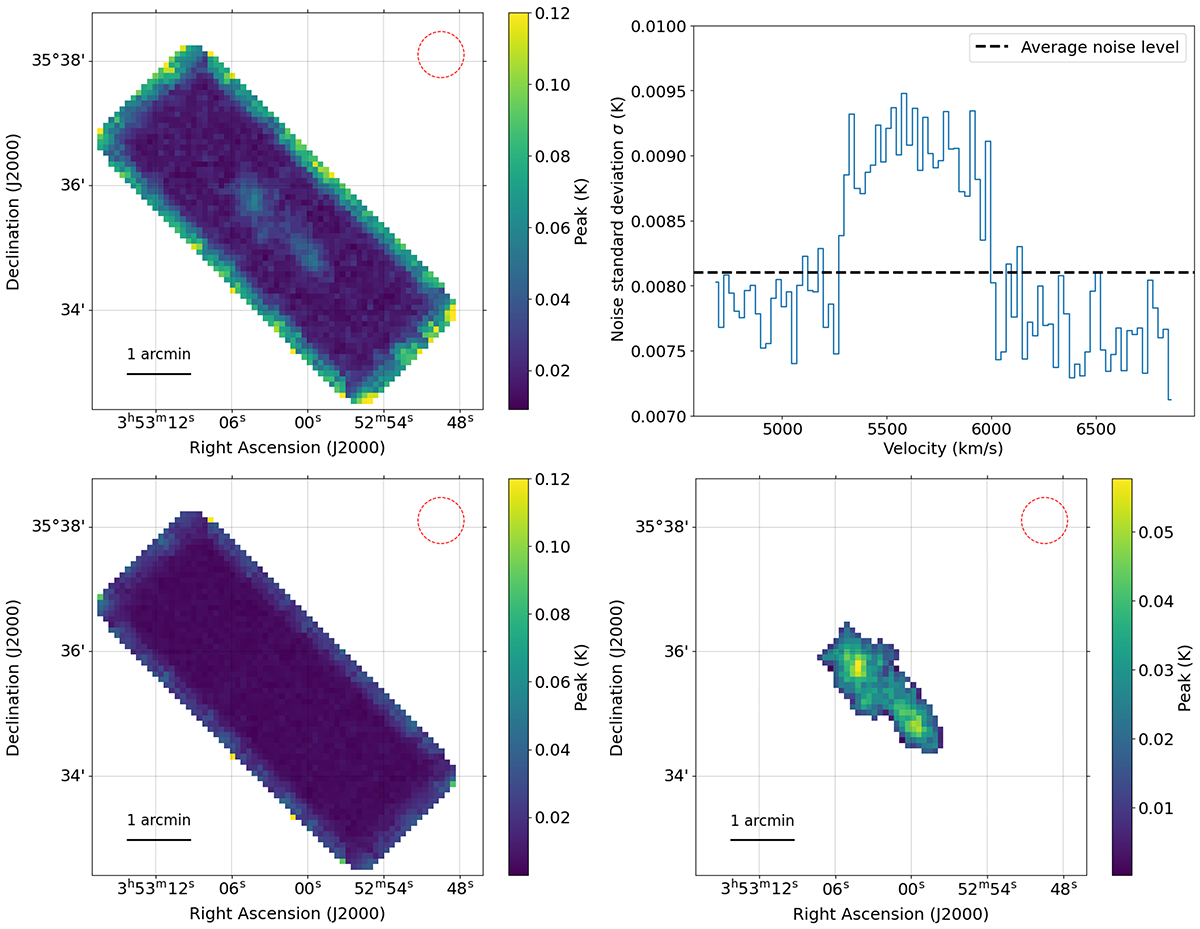
Fig. 5.
Download original image
Signal and noise maps derived from the IRAM CO(1−0) datacube. Top left: Peak intensity of the brightness temperature (K) of the original cube. Top right: Noise level (σ) over the spectral range of the cube. The dotted black line represents the average level of noise (σ = 0.0081 K), used to create the following panel. As seen in the central channels, we cannot completely separate the cube’s signal from its noise, even after sigma-clipping. Bottom left: Noise model, or the spatial distribution of noise to be subtracted from the original map. Bottom right: Region with signal that surpasses 5σ. The dashed red circle in the upper-right corner shows the 22.49 arcsec beam size of the IRAM observation.
Current usage metrics show cumulative count of Article Views (full-text article views including HTML views, PDF and ePub downloads, according to the available data) and Abstracts Views on Vision4Press platform.
Data correspond to usage on the plateform after 2015. The current usage metrics is available 48-96 hours after online publication and is updated daily on week days.
Initial download of the metrics may take a while.