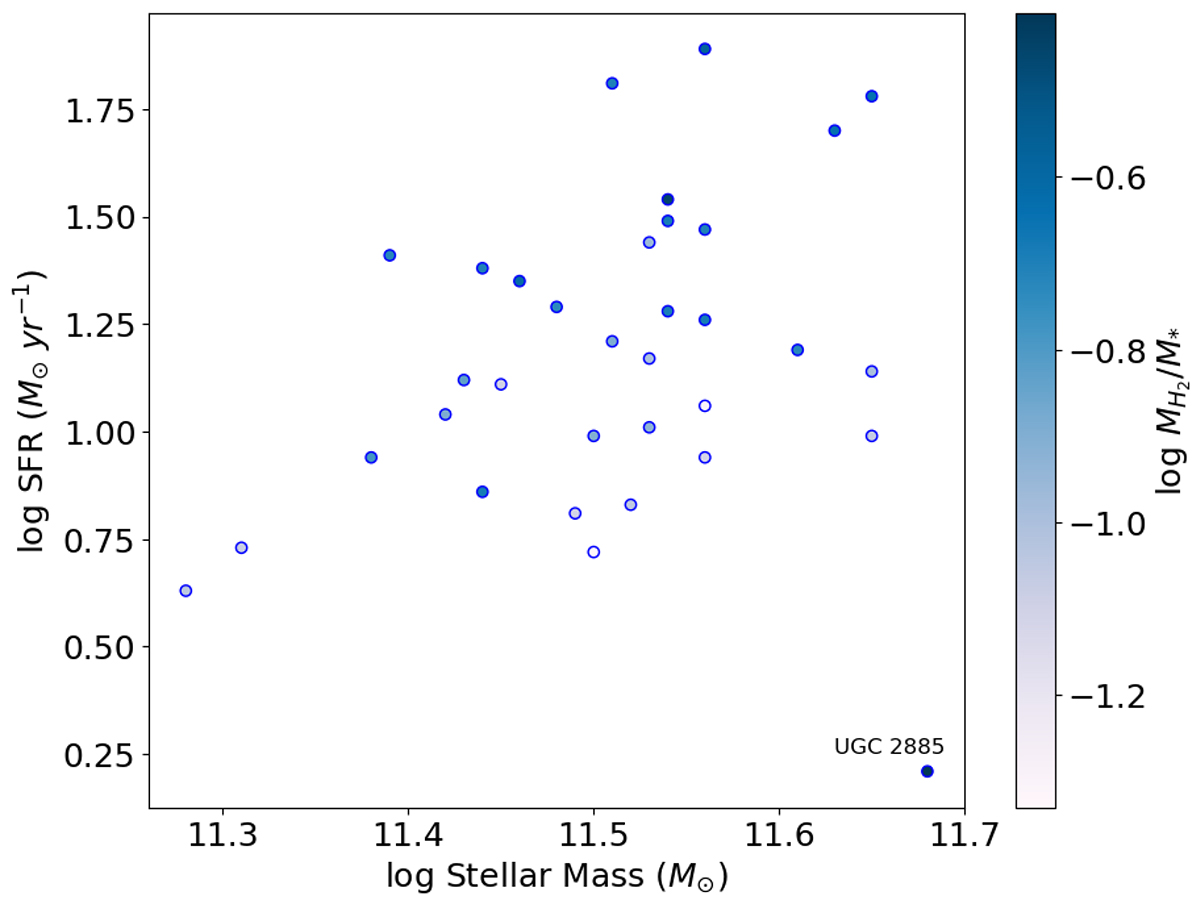
Fig. 11.
Download original image
SFR as a function of stellar mass for a sample of massive disc galaxies (Lisenfeld et al. 2023) colour-coded by their molecular-to-stellar mass ratio (MH2/M⋆). UGC 2885 is displayed for comparison but was not included in the fitting of the SFR–M⋆ plane. The range of stellar masses differs from that of Fig. 10, as super-spiral galaxies have logM⋆ > 10.47 M⊙.
Current usage metrics show cumulative count of Article Views (full-text article views including HTML views, PDF and ePub downloads, according to the available data) and Abstracts Views on Vision4Press platform.
Data correspond to usage on the plateform after 2015. The current usage metrics is available 48-96 hours after online publication and is updated daily on week days.
Initial download of the metrics may take a while.