Open Access
Fig. 10.
Download original image
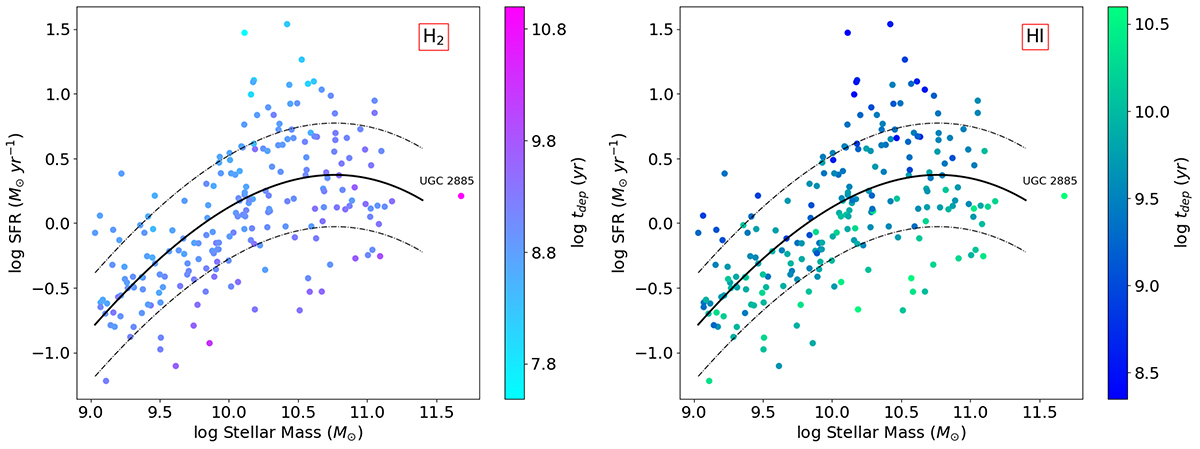
SFMS of the xCOLD GASS sample with available ALFALFA H I fluxes. The solid line is the SFMS, and the dashed lines show ±0.4 dex scatter as described by Saintonge et al. (2017). Colour represents the depletion time (tdep) of the molecular gas (left panel) and atomic gas (right panel).
Current usage metrics show cumulative count of Article Views (full-text article views including HTML views, PDF and ePub downloads, according to the available data) and Abstracts Views on Vision4Press platform.
Data correspond to usage on the plateform after 2015. The current usage metrics is available 48-96 hours after online publication and is updated daily on week days.
Initial download of the metrics may take a while.