Fig. 9
Download original image
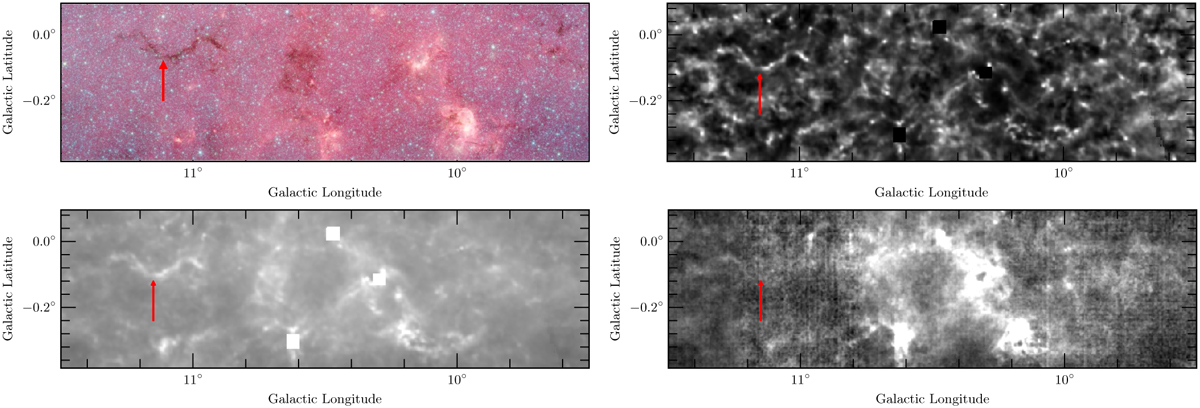
Comparison of GLIMPSE 3603.6 μm (orange) and 4.5 μm (red) Spitzer-IRAC image (top left), the normalized column density map (top right), the column density map (bottom left) and the COHRS 12CO (3–2) velocity-integrated image (bottom right) in a region of the Gp centred at (l, b) =10.50°, −0.18°. Weote the presence of the infrared dark cloud G11.11–0.12, the Galactic ‘Snake’, identified by the red arrow. The original column density is displayed logarithmic scale and spans the range 1 × 10²¹ to 1 × 1023 cm−2. The COHRS image is represented in a linear scale with intensity that spans the range of 0–100 K km/s.
Current usage metrics show cumulative count of Article Views (full-text article views including HTML views, PDF and ePub downloads, according to the available data) and Abstracts Views on Vision4Press platform.
Data correspond to usage on the plateform after 2015. The current usage metrics is available 48-96 hours after online publication and is updated daily on week days.
Initial download of the metrics may take a while.