Fig. 6
Download original image
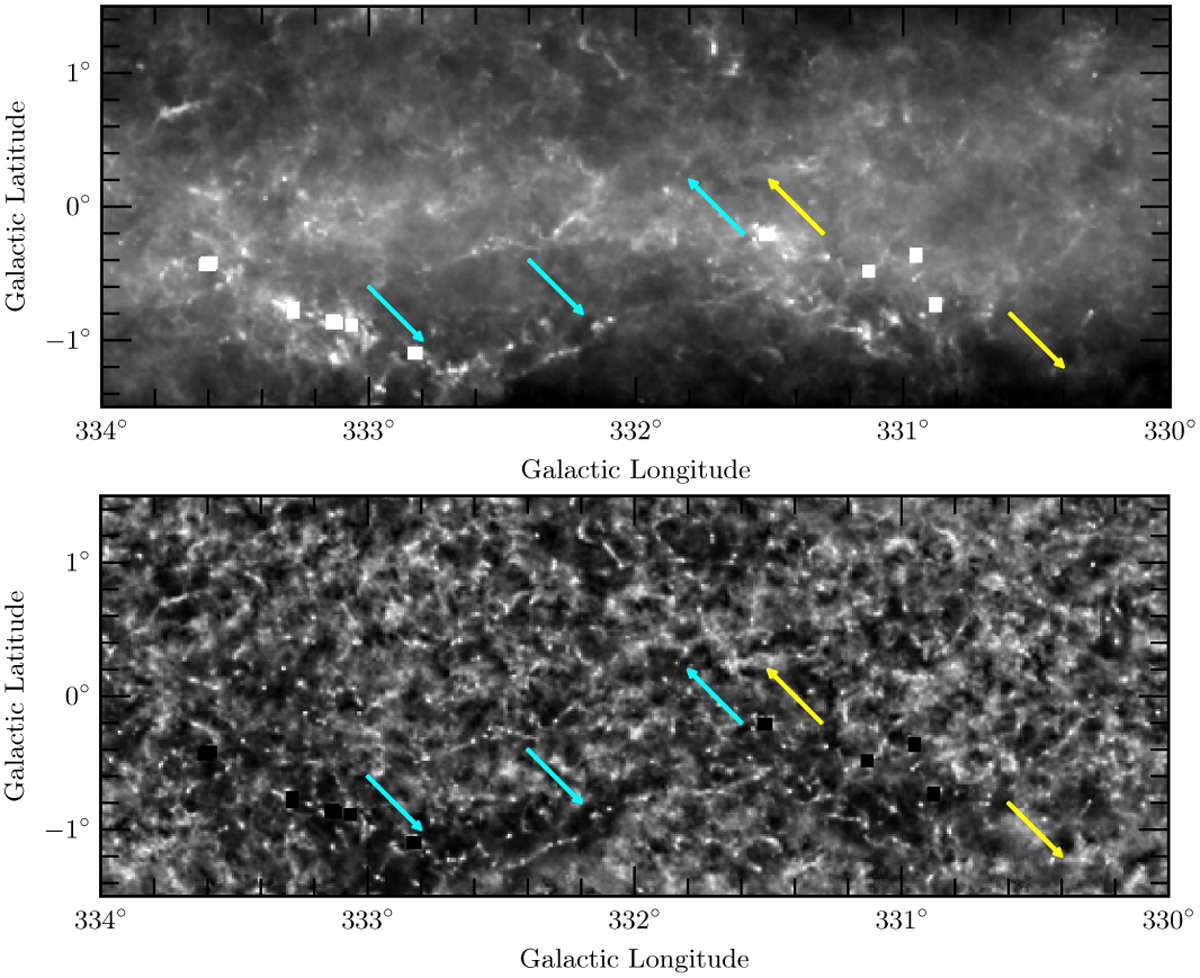
Comparison of the column density map (top) and the corresponding local normalized column density image (bottom) on a high-density region of the Gp centred at (l, b) = 332°, 0°. Examples of high- and low-contrast filaments (see text) present on the original column density map (top) and their counterparts on the normalized map (bottom) are identified with cyan and yellow arrows, respectively. The original column density map is represented in logarithmic scale and spans the range 6 × 10²¹ to 1 × 1023 cm−2. The white and black squares on the original column density and normalized map, respectively, are saturated regions.
Current usage metrics show cumulative count of Article Views (full-text article views including HTML views, PDF and ePub downloads, according to the available data) and Abstracts Views on Vision4Press platform.
Data correspond to usage on the plateform after 2015. The current usage metrics is available 48-96 hours after online publication and is updated daily on week days.
Initial download of the metrics may take a while.