Open Access
Fig. A.2
Download original image
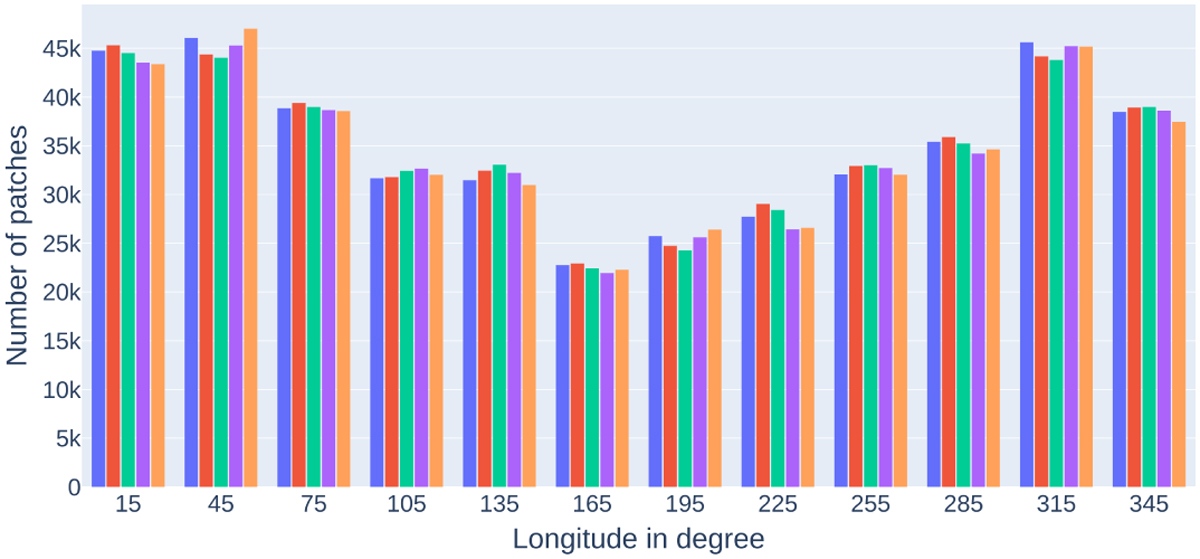
For each subset, the histogram of the number of patches is split as a function of the longitude (one colour per subset). The variability along the longitude axis is the result of noisy regions removed from the dataset.
Current usage metrics show cumulative count of Article Views (full-text article views including HTML views, PDF and ePub downloads, according to the available data) and Abstracts Views on Vision4Press platform.
Data correspond to usage on the plateform after 2015. The current usage metrics is available 48-96 hours after online publication and is updated daily on week days.
Initial download of the metrics may take a while.