Fig. 18
Download original image
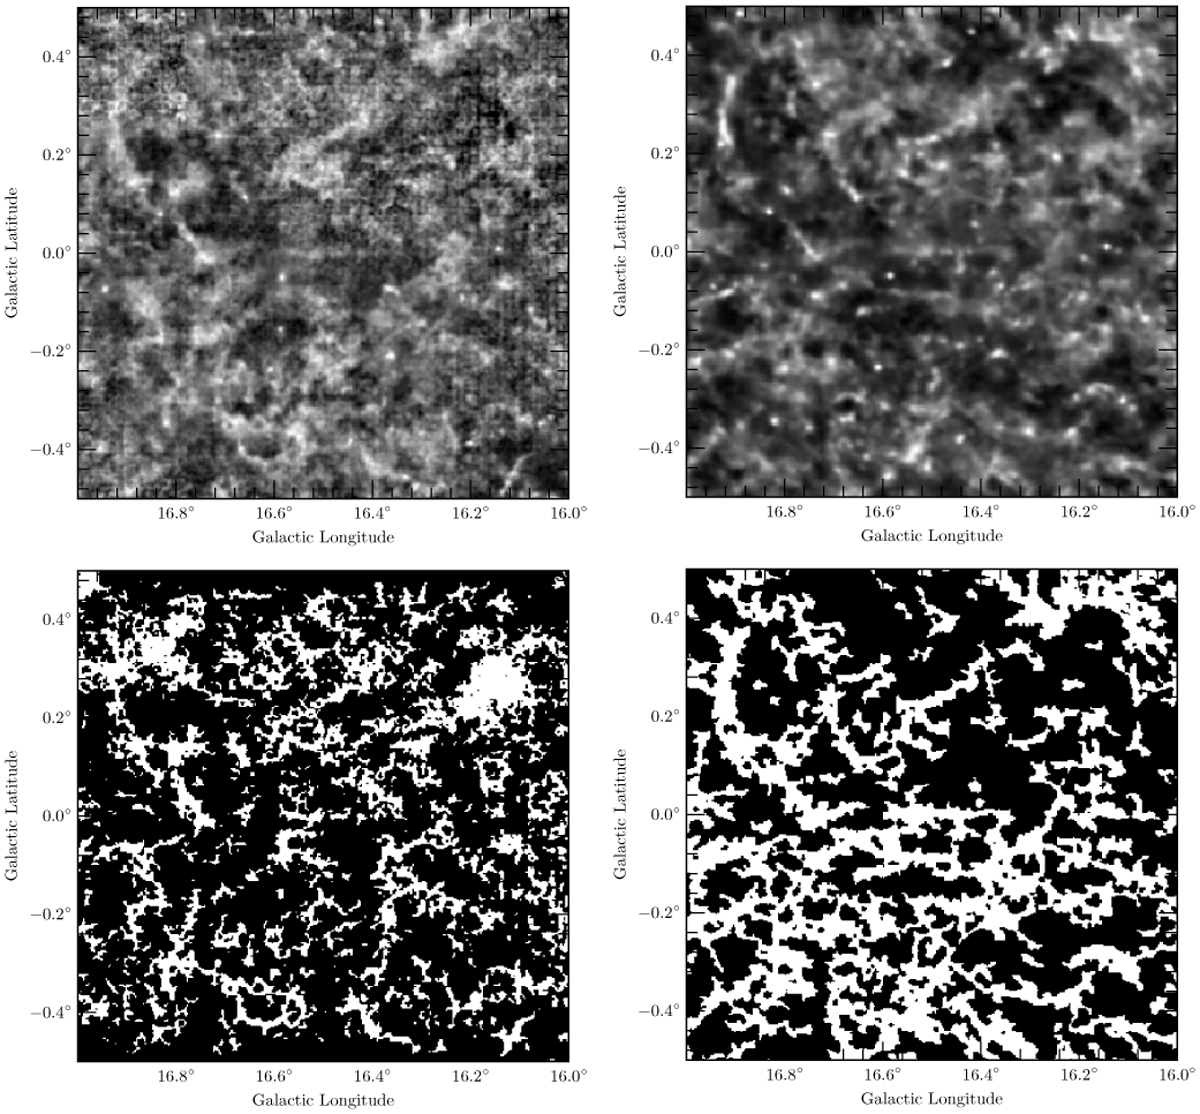
Segmentation of the velocity-integrated 2D (position, position) 12 CO (3–2) COHRS map using the model learnt on the column density image of the Gp with PE-UNet-L at the location centred at (l, b) = 16.5°, 0°. The min–max normalized COHRS (top left) and NH2 (top right) maps are shown. The corresponding segmented maps using the PE-UNet-L learnt model on NH2 data are shown for COHRS (bottom left) and NH2 (bottom right).
Current usage metrics show cumulative count of Article Views (full-text article views including HTML views, PDF and ePub downloads, according to the available data) and Abstracts Views on Vision4Press platform.
Data correspond to usage on the plateform after 2015. The current usage metrics is available 48-96 hours after online publication and is updated daily on week days.
Initial download of the metrics may take a while.