Fig. 8
Download original image
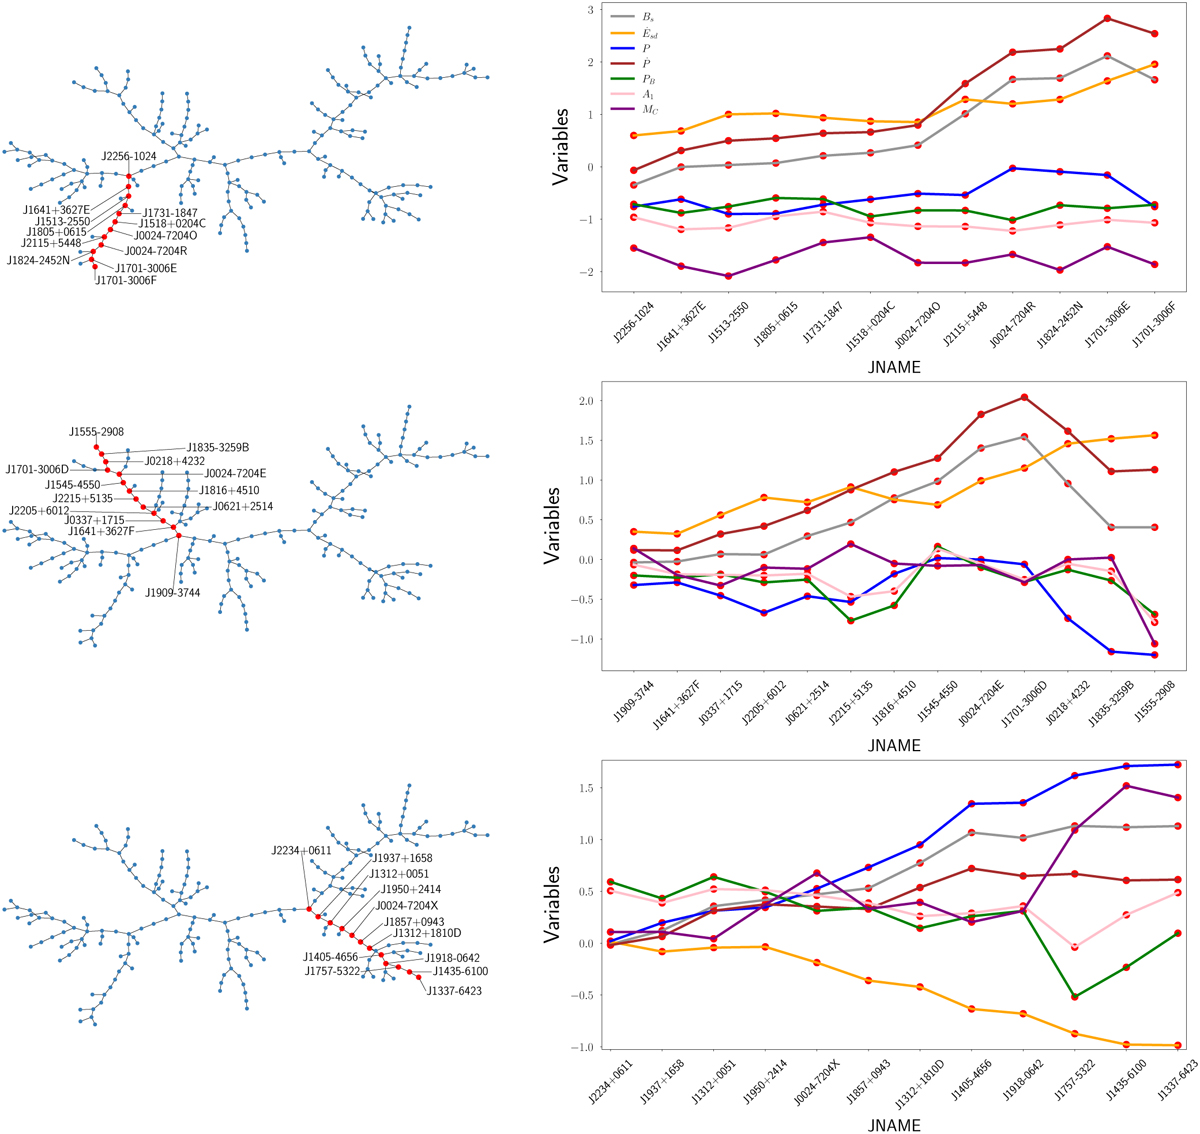
Examples of the values of P, ![]() , Bs,
, Bs, ![]() , MC, A1, and PB (the legend shown in the first row applies to all rows) along a path in the MST. Left column: selected paths in the MST are shown and nodes are shown in red. Right column: scaled variables are shown on the y-axis (using the robust scaler, i.e., subtracting the median and dividing by the interquartile range for the whole population considered), and the pulsars of the selected path are shown on the x-axis (nodes in red) through their identifier according to the ATNF catalog. The order shown responds to the path reading in the MST, which always goes from the central part (trunk) to the ends of the MST.
, MC, A1, and PB (the legend shown in the first row applies to all rows) along a path in the MST. Left column: selected paths in the MST are shown and nodes are shown in red. Right column: scaled variables are shown on the y-axis (using the robust scaler, i.e., subtracting the median and dividing by the interquartile range for the whole population considered), and the pulsars of the selected path are shown on the x-axis (nodes in red) through their identifier according to the ATNF catalog. The order shown responds to the path reading in the MST, which always goes from the central part (trunk) to the ends of the MST.
Current usage metrics show cumulative count of Article Views (full-text article views including HTML views, PDF and ePub downloads, according to the available data) and Abstracts Views on Vision4Press platform.
Data correspond to usage on the plateform after 2015. The current usage metrics is available 48-96 hours after online publication and is updated daily on week days.
Initial download of the metrics may take a while.