Fig. 5
Download original image
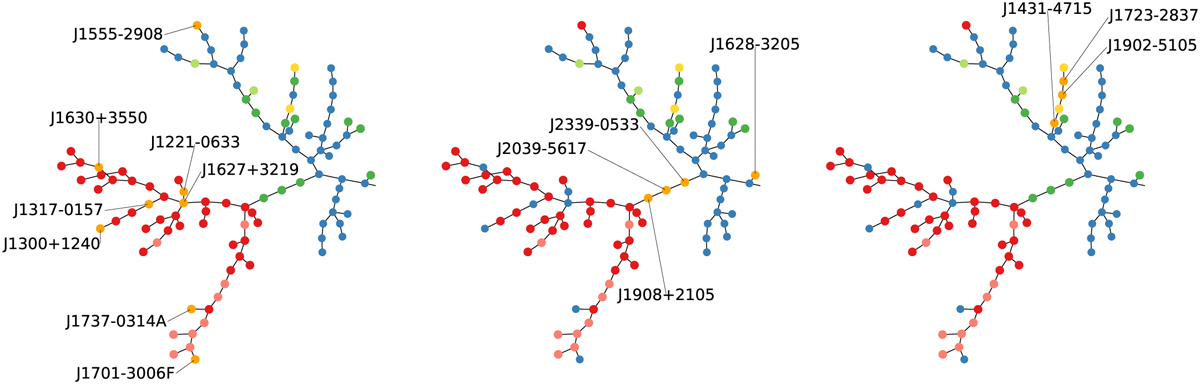
Zoom onto the leftmost part of the MST shown in Fig. 4. The locations of the pulsars (shown in orange) discussed in Sect. 2.3.1 (left panel), Sect. 2.3.2 (central panel), and Sect. 2.3.3 (right panel) can be seen more clearly here. The same color code is used as in Fig. 4, where the confirmed BWs appear in red, RBs in green, tMSPs in yellow, and the BWs and RBs in globular clusters are shown in light red and light green, keeping the unclassified pulsars in blue.
Current usage metrics show cumulative count of Article Views (full-text article views including HTML views, PDF and ePub downloads, according to the available data) and Abstracts Views on Vision4Press platform.
Data correspond to usage on the plateform after 2015. The current usage metrics is available 48-96 hours after online publication and is updated daily on week days.
Initial download of the metrics may take a while.