Fig. 3
Download original image
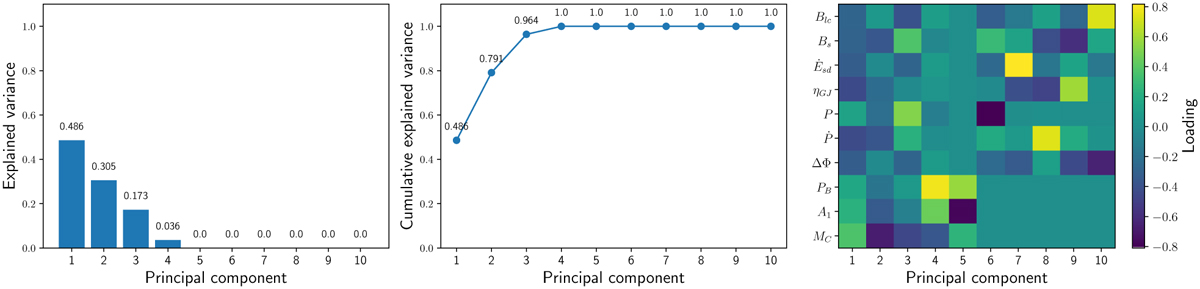
PCA results for the logarithm of the set of variables for the whole population of 218 MSPs. The left panel, also called the scree plot, shows the explained variance of each PC according to the eigenvalues of the covariance matrix. We note that the covariance matrix calculates the relationships between pairs of variables, showing how changes in one variable are associated with changes in another. It represents the amount of information contained in each PC. The central panel shows the cumulative explained variance by the new variables defined through the PCA analysis. The right panel shows the “weight” (also called loading) that each variable has concerning each PC, indicating its contribution to the variance captured by that PC. This value is the coefficient held in each eigenvector of the covariance matrix. Negative values imply that the variable and the PC are negatively correlated. Conversely, a positive value shows a positive correlation between the PC and the variable.
Current usage metrics show cumulative count of Article Views (full-text article views including HTML views, PDF and ePub downloads, according to the available data) and Abstracts Views on Vision4Press platform.
Data correspond to usage on the plateform after 2015. The current usage metrics is available 48-96 hours after online publication and is updated daily on week days.
Initial download of the metrics may take a while.