Fig. 2
Download original image
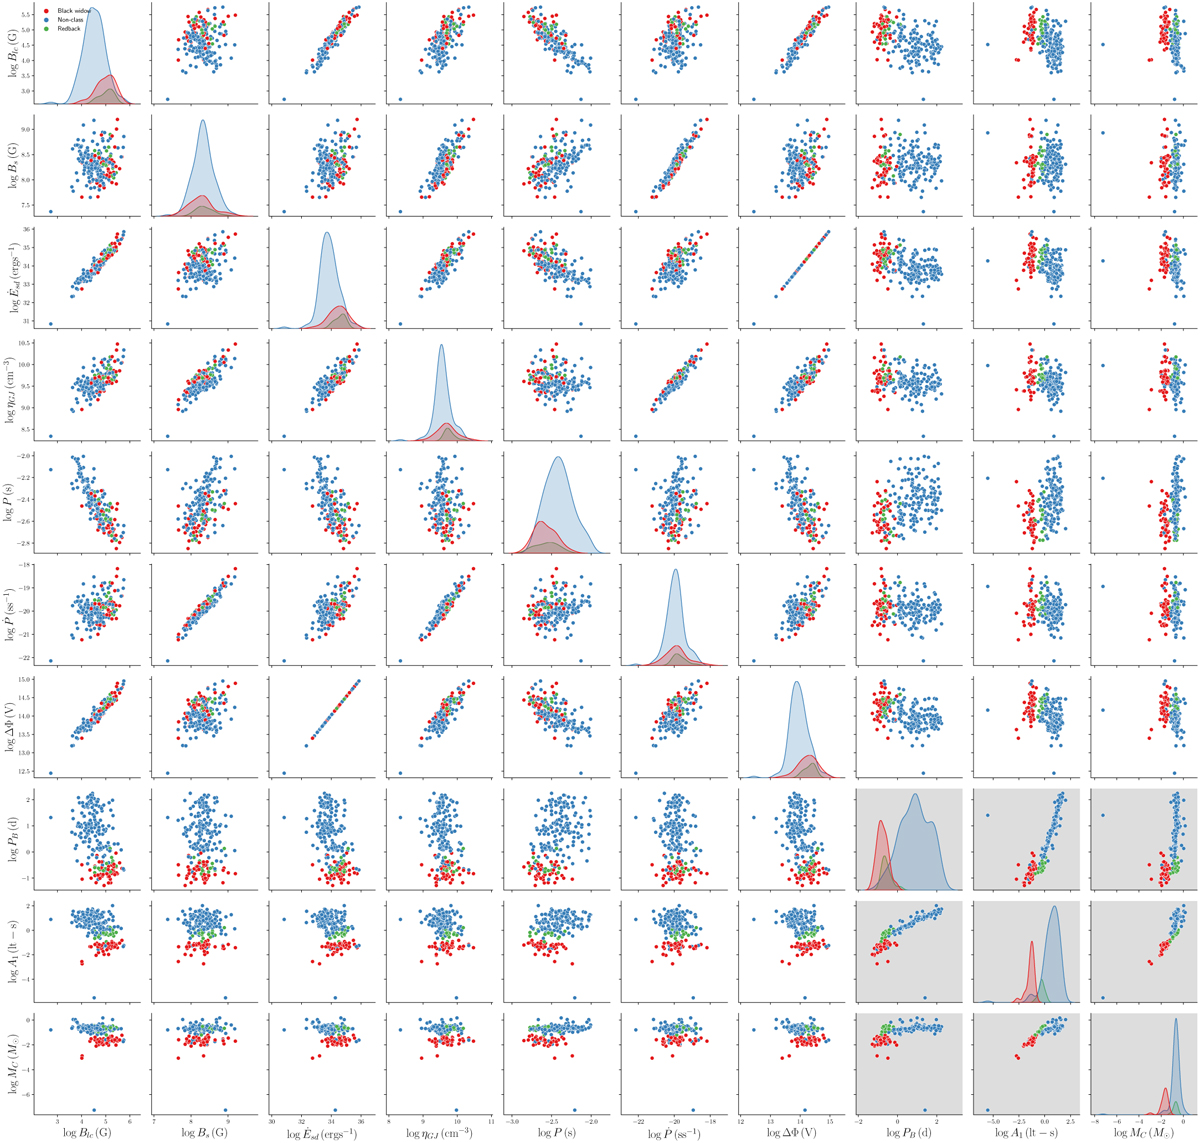
Cross-dependence of the ten variables considered. Confirmed BWs (in red) and RBs (in green) are separately noted. For visualization reasons, no distinction is made between MSPs residing in globular clusters and those not, and the tMSPs are marked in green due to their behavior as RBs. The pulsars not yet assigned to any of these classes are shown in blue. The main diagonal shows the distribution for each variable. The panels with the shaded background show the pairs formed with PB, MC, and A1, which best differentiate the BWs from the rest.
Current usage metrics show cumulative count of Article Views (full-text article views including HTML views, PDF and ePub downloads, according to the available data) and Abstracts Views on Vision4Press platform.
Data correspond to usage on the plateform after 2015. The current usage metrics is available 48-96 hours after online publication and is updated daily on week days.
Initial download of the metrics may take a while.