Fig. 8.
Download original image
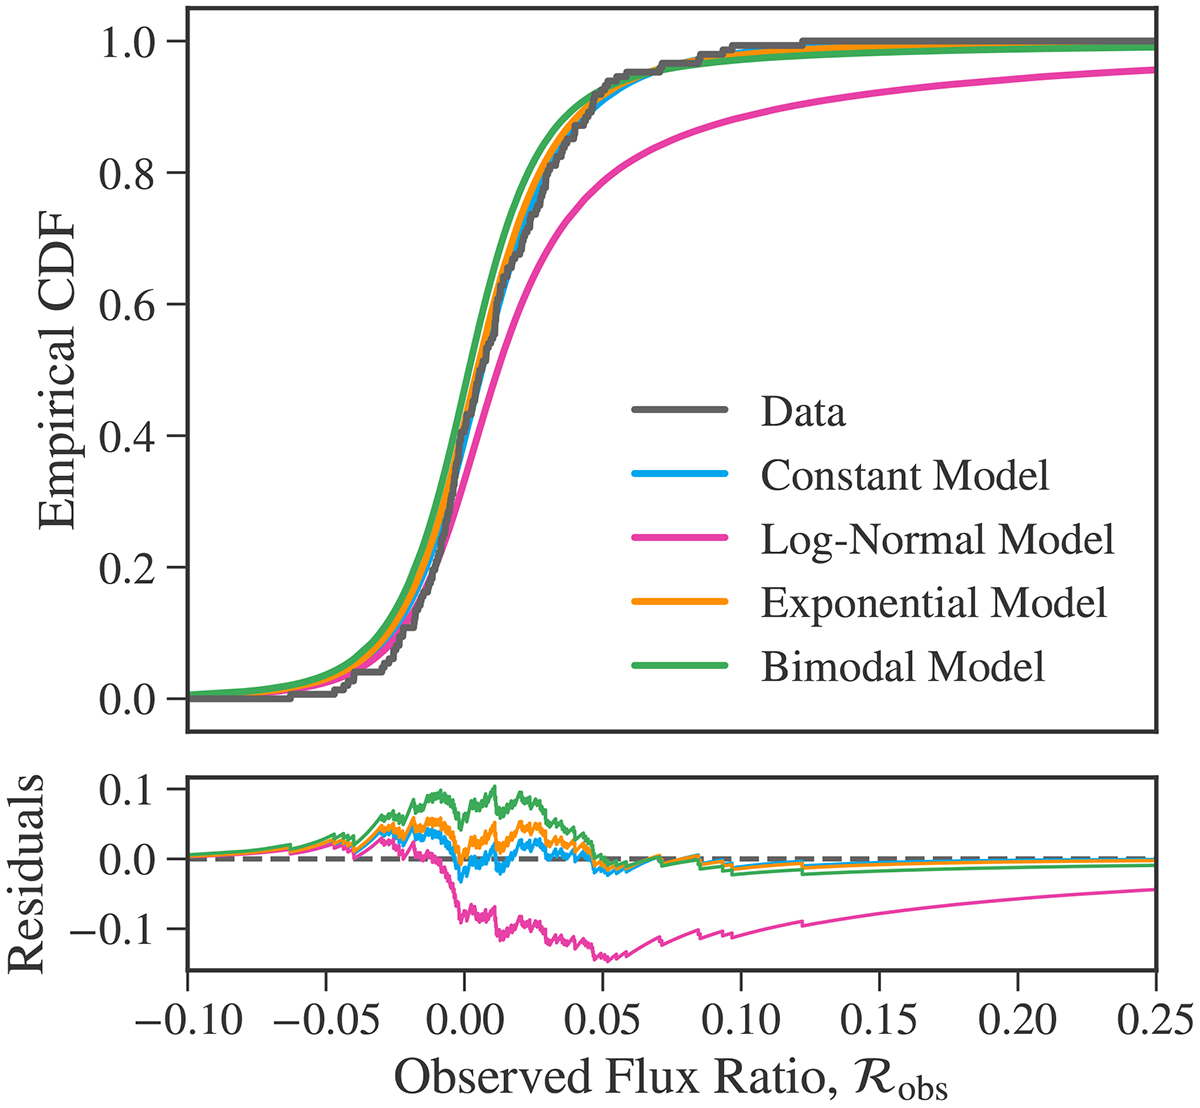
Posterior predictive test of the four models. (Top) Visual illustration of the KS score, which measures the maximum difference between the eCDF of the observed flux ratios, ℛobs (plotted in black), and the eCDF of a simulated ℛobs distribution dependent on respectively the constant, log-normal, exponential, and bimodal model distribution of the escape fraction as inferred from the Bayesian framework. (Bottom) Residual (the model eCDF minus the data eCDF).
Current usage metrics show cumulative count of Article Views (full-text article views including HTML views, PDF and ePub downloads, according to the available data) and Abstracts Views on Vision4Press platform.
Data correspond to usage on the plateform after 2015. The current usage metrics is available 48-96 hours after online publication and is updated daily on week days.
Initial download of the metrics may take a while.