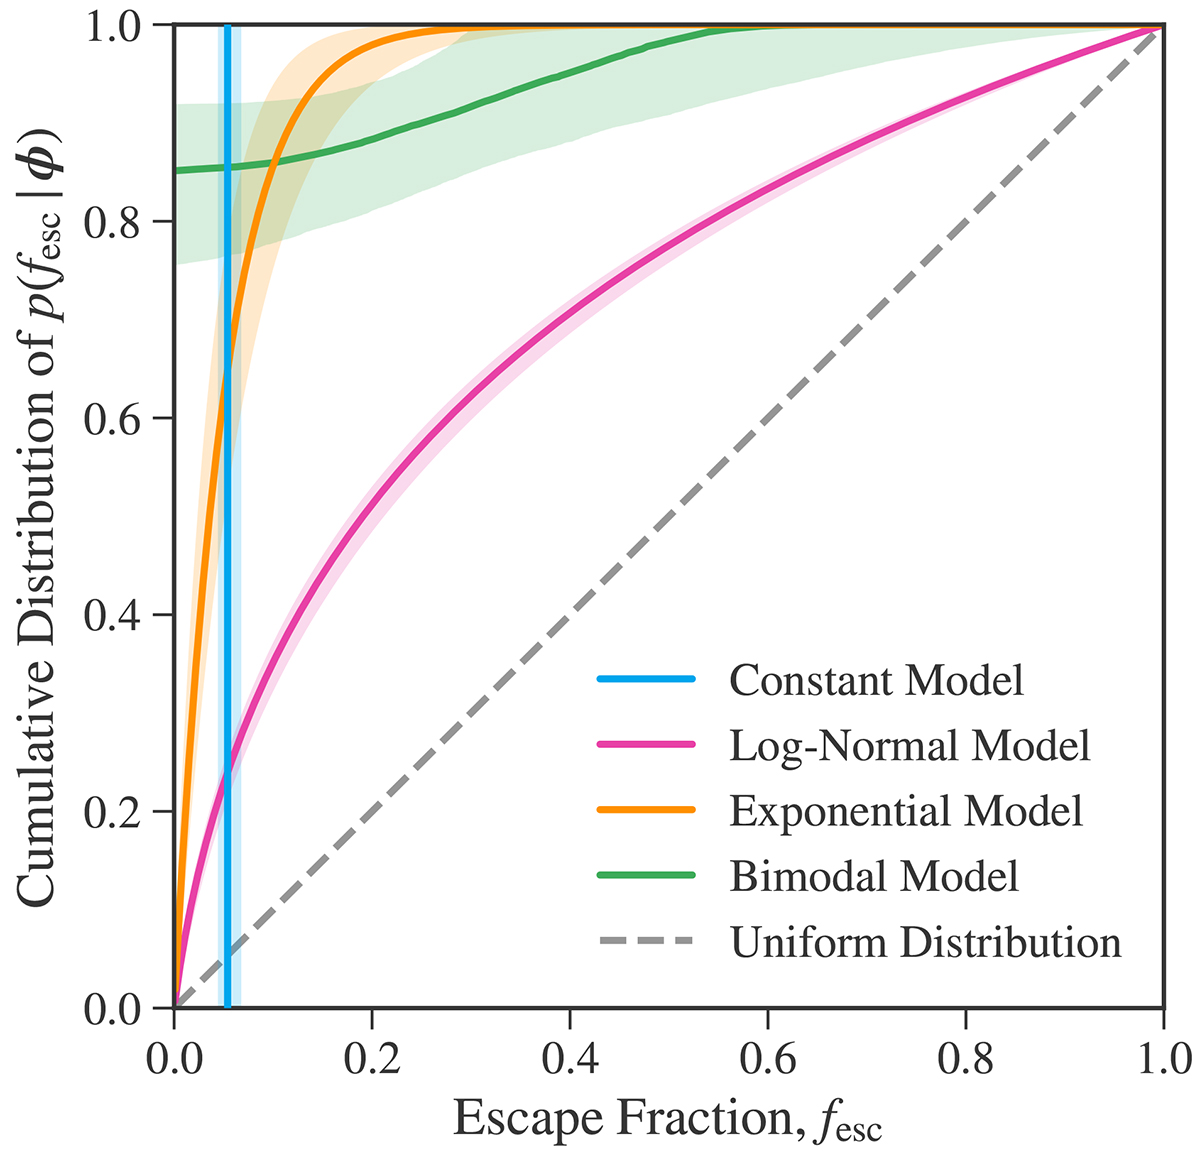
Fig. 7.
Download original image
Median cumulative distribution of the population distribution of escape fractions for each of the four models. For each model we (i) selected 10 000 parameter sets from the chains of posterior samples displayed in Fig. 6, (ii) evaluated the CDF of the distribution given by the selected population parameters on a grid of escape fractions, and (iii) computed the median of the 10 000 corresponding CDF values for each index of the escape fraction grid. The median is shown as a solid line, while the shaded region marks the 16th and 84th percentile intervals. For reference, we plot the CDF of a uniform distribution as a dashed line.
Current usage metrics show cumulative count of Article Views (full-text article views including HTML views, PDF and ePub downloads, according to the available data) and Abstracts Views on Vision4Press platform.
Data correspond to usage on the plateform after 2015. The current usage metrics is available 48-96 hours after online publication and is updated daily on week days.
Initial download of the metrics may take a while.